Building Comfort
13 minute read
Imagine you manage a building and want to know — the instant it happens — when any room becomes uncomfortable: too hot, too cold, or stuffy with CO2. You don’t want to poll sensors on a timer or wire up a stream processor by hand. You just want to describe what “uncomfortable” means and have something watch every room, floor, and the whole building for you, continuously.
This tutorial builds a Building Comfort monitoring demo on Drasi Server. A PostgreSQL database holds a building made of floors and rooms, each room reporting temperature, humidity, and co2. You’ll start Drasi Server with a single configuration, watch a live dashboard light up, and then change room readings and see everything react in real time — without writing any application code, and without building a bespoke web UI. Instead of a hand-written dashboard, the demo uses Drasi Server’s built-in dashboard reaction.
What you’ll build: a running Drasi Server that connects to PostgreSQL and reacts to room sensor changes in real time, assembled from Drasi’s three core building blocks:
| Step | What You’ll Do | Time |
|---|---|---|
| Step 1: Set Up Your Environment | Open the dev container (or install Drasi Server locally) | 5 min |
| Step 2: Run the Demo | One command starts PostgreSQL and Drasi Server | 3 min |
| Step 3: Open the Dashboard | Watch comfort levels and alerts live | 2 min |
| Step 4: Drive Change | Break, reset, and simulate rooms — and watch Drasi react instantly | 5 min |
| How It Works | Understand the source, the six queries, the synthetic joins, and the dashboard | 5 min |
- Terminals: you’ll use two. Terminal 1 runs the demo (it stays in the foreground). Use Terminal 2 for the helper scripts that change data.
- Working directory: run every command from the tutorial directory (
tutorials/building-comfort/). The dev container opens there automatically; if you’re running locally,cd tutorials/building-comfortfirst. - Command tabs: commands are shown in tabs (bash / zsh and PowerShell) — use the one for your shell. The dev container and Codespaces use bash.
- Ports: the Drasi Server API is on
8380, the dashboard is on3000, and PostgreSQL is published on5732.
Step 1 of 4: Set Up Your Environment
The easiest way to follow this tutorial is the dev container, which installs everything for you. You can also run locally if you prefer.
Option A: Dev Container or GitHub Codespaces (recommended)
- Open the
learning-drasi-serverrepository in VS Code and run Reopen in Container (or create a Codespace from the repo’s Code menu). - When prompted for a configuration, choose Drasi Server - Building Comfort Tutorial.
- Wait for the container to finish. Its setup script downloads the Drasi Server binary and installs the PostgreSQL client.
That’s it — skip ahead to Step 2.
Option B: Run Locally
You’ll need Docker (for PostgreSQL) and bash (the helper scripts use it; on Windows use Git Bash or WSL). From the repository root, move into the tutorial directory and download the Drasi Server binary:
cd tutorials/building-comfort
bash scripts/download.sh
cd tutorials/building-comfort
powershell -ExecutionPolicy Bypass -File scripts/download.ps1This places the binary at bin/drasi-server (or bin\drasi-server.exe on Windows) inside the tutorial directory.
Option C: Build from Source
Prefer to compile Drasi Server yourself? Follow the Build from Source installation guide to clone the repository and build the binary.
Once it is built, make the drasi-server binary available to this tutorial’s helper scripts — either add it to your PATH, or copy it into this tutorial’s bin/ directory (the same location Option B uses):
cd tutorials/building-comfort
mkdir -p bin
cp /path/to/drasi-server/bin/drasi-server bin/drasi-server
cd tutorials/building-comfort
New-Item -ItemType Directory -Force bin | Out-Null
Copy-Item C:\path\to\drasi-server\bin\drasi-server.exe bin\drasi-server.exeStep 2 of 4: Run the Demo
Everything runs from a single configuration file, server-config.yaml. In Terminal 1, start the demo:
bash scripts/start-demo.shpowershell -ExecutionPolicy Bypass -File scripts/start-demo.ps1The start-demo script does two things: it starts PostgreSQL (seeding one building, three floors, and nine rooms — every room comfortable to begin with) and then runs Drasi Server in the foreground.
On first start, Drasi Server downloads the plugins it needs (source/postgres, bootstrap/postgres, reaction/dashboard, reaction/log) from ghcr.io/drasi-project and caches them under ~/.drasi/plugins, connects to the database, and starts the six continuous queries and the dashboard. When you see a line like the following, it’s ready:
Drasi Server started successfully with API on port 8380
Leave this running. Everything else happens from Terminal 2 (or your browser).
Press Ctrl+C in Terminal 1 to stop the server. To remove the database container when you’re completely done, run bash scripts/cleanup.sh (bash) or powershell -ExecutionPolicy Bypass -File scripts/cleanup.ps1 (PowerShell). Add --volumes (bash) or -RemoveVolumes (PowerShell) to also delete the data.
Step 3 of 4: Open the Dashboard
Drasi Server’s dashboard reaction hosts a live web dashboard — there’s no separate app to build or run. Wait until Terminal 1 prints Drasi Server started successfully (on the first run this takes ~30 seconds while the plugins download), then open it in your browser:
http://localhost:3000
In the dev container or Codespaces, port 3000 is forwarded automatically — VS Code shows a notification when the dashboard is ready, and you can also open it from the Ports panel (the Comfort Dashboard entry). If you open the page before the server has finished starting, just refresh once it’s ready.
You’ll see the Building Comfort dashboard:
- Building Comfort (the large panel) — the building grouped by floor, with each room’s comfort level and sensor readings. Every room starts at comfort
46(comfortable). - Building Comfort KPI and gauge — the building’s overall comfort level.
- Comfort Alerts and Floor Alerts — empty for now; rooms and floors appear here only when they need attention.
- Floor Comfort — a table of each floor’s comfort level.
The dashboard updates the instant the data changes — no refreshing. Let’s make something change.
Step 4 of 4: Drive Change
With Terminal 1 running the demo and the dashboard open, use Terminal 2 to change room readings and watch Drasi react.
The helper scripts below don’t talk to Drasi Server at all. Each one runs a plain SQL UPDATE against PostgreSQL — exactly what an existing building-management app would already do. There’s no API to call, no event to publish, and no application code in the loop. Drasi observes the row change through PostgreSQL’s logical replication (CDC), re-evaluates the affected queries, and updates the dashboard on its own. The PowerShell tabs make this obvious — they’re just raw psql UPDATE statements, and the bash scripts wrap the same SQL.
Break a room
Push a single room out of the comfortable band (sets temperature = 40, humidity = 20, co2 = 700):
bash scripts/break-room.sh room_01_01_01docker exec building-comfort-postgres psql -U drasi_user -d building_comfort -c "UPDATE \"Room\" SET temperature=40, humidity=20, co2=700 WHERE id='room_01_01_01';"Within about a second the dashboard reacts: Room 01 on Floor 01 drops out of the comfortable band, the building gauge falls, and entries appear in Comfort Alerts and Floor Alerts. The server console (Terminal 1) logs the alerts too.
Reset a room (or all rooms)
Return a room — or the whole building — to comfortable defaults (70 / 40 / 10):
# Reset one room
bash scripts/reset-room.sh room_01_01_01

# Reset every room
bash scripts/reset-room.sh
docker exec building-comfort-postgres psql -U drasi_user -d building_comfort -c "UPDATE \"Room\" SET temperature=70, humidity=40, co2=10 WHERE id='room_01_01_01';"The alerts clear and the building returns to green.
Set custom values
Try partial degradation — make a room too hot without touching CO2:
# set-room.sh <room_id> <temperature> <humidity> <co2>
bash scripts/set-room.sh room_01_02_03 82 40 10
docker exec building-comfort-postgres psql -U drasi_user -d building_comfort -c "UPDATE \"Room\" SET temperature=82, humidity=40, co2=10 WHERE id='room_01_02_03';"That gives 50 + (82-72) + (40-42) + 0 = 58 — above 50, so the room and its floor raise alerts even though humidity and CO2 are fine.
Let it run hands-free
To keep the dashboard alive without typing, run the simulator. It picks a random room every few seconds and assigns new readings, so comfort levels rise and fall and alerts come and go on their own:
bash scripts/simulate.sh# The simulator is a bash script; run it from Git Bash or WSL:
bash scripts/simulate.shPress Ctrl+C to stop the simulator, then reset-room.sh to return everything to comfortable.
How It Works
Everything you just ran is described by the single server-config.yaml. Here’s what each part does.
The Source
sources:
  - kind: postgres
    id: building-facilities
    autoStart: true

    # Connection (supplied via environment variables, with defaults)
    host: "${POSTGRES_HOST:-localhost}"
    port: ${POSTGRES_PORT:-5732}
    database: "${POSTGRES_DATABASE:-building_comfort}"
    user: "${POSTGRES_USER:-drasi_user}"
    password: "${POSTGRES_PASSWORD:-drasi_password}"
    sslMode: prefer

    # Tables to monitor (PascalCase so node labels match the queries)
    tables:
      - Building
      - Floor
      - Room

    # Logical replication slot + publication
    slotName: drasi_building_comfort_slot
    publicationName: drasi_building_comfort_pub

    # Primary key of each table, so Drasi can track row identity
    tableKeys:
      - table: Building
        keyColumns:
          - id
      - table: Floor
        keyColumns:
          - id
      - table: Room
        keyColumns:
          - id

    # Load the rows that already exist when the server starts
    bootstrapProvider:
      kind: postgres
The PostgreSQL source connects with the credentials above (provided via environment variables, with sensible defaults) and uses logical replication (CDC) to stream changes from the Building, Floor, and Room tables. tableKeys tells Drasi the primary key of each table so it can track row identity across changes. The bootstrap provider loads the rows that already exist when the server starts; after that, every UPDATE you make (via the helper scripts) flows to Drasi as a change. The table names are quoted and PascalCase so the node labels Drasi sees match the queries exactly: (r:Room), (f:Floor), (b:Building). For every option the source accepts, see Configure the PostgreSQL Source.
The Continuous Queries
Each query computes a comfort level with the same formula. A value between 40 and 50 is comfortable; the seed values (70°F, 40%, 10 ppm) give 50 + (70-72) + (40-42) + 0 = 46.
floor( 50 + (r.temperature - 72) + (r.humidity - 42)
      + CASE WHEN r.co2 > 500 THEN (r.co2 - 500) / 25 ELSE 0 END )
There are six queries:
| Query | What it returns |
|---|---|
building-comfort-ui |
One row per room with its comfort level — the feed that drives the dashboard view |
building-comfort-level-calc |
The building’s overall comfort level |
floor-comfort-level-calc |
Each floor’s average comfort level |
room-alert |
Only the rooms whose comfort is outside 40–50 |
floor-alert |
Only the floors whose average comfort is outside 40–50 |
building-alert |
The building, when its overall comfort is outside 40–50 |
Synthetic joins connect the entities
PostgreSQL knows Room.floor_id references Floor.id through a foreign key, but Drasi doesn’t read foreign keys. Instead, each query declares the relationships it needs as synthetic joins, so the Cypher can walk from room to floor to building:
sources:
  - sourceId: building-facilities
    nodes:
      - Room
      - Floor
      - Building
joins:
  - id: PART_OF_FLOOR
    keys:
      - label: Room
        property: floor_id
      - label: Floor
        property: id
  - id: PART_OF_BUILDING
    keys:
      - label: Floor
        property: building_id
      - label: Building
        property: id
With those joins declared, a query can match the whole hierarchy:
MATCH (r:Room)-[:PART_OF_FLOOR]->(f:Floor)-[:PART_OF_BUILDING]->(b:Building)
Aggregating up the hierarchy
Half of the queries don’t just read rooms — they roll comfort levels up the building. In a Continuous Query, an aggregate such as avg() inside a WITH groups by whatever non-aggregated values travel alongside it, exactly like SQL’s GROUP BY.
One stage — average a floor’s rooms. floor-comfort-level-calc keeps the floor f in the WITH, so avg() produces one value per floor:
WITH f, floor( 50 + (r.temperature - 72) + ... ) AS RoomComfortLevel
WITH f, avg(RoomComfortLevel) AS ComfortLevel
RETURN f.id AS FloorId, ComfortLevel
Two stages — average the averages. building-alert aggregates twice. Carrying f, b groups the first avg() by floor; dropping f from the next WITH widens the grouping so the second avg() rolls the floor averages up into a single building level:
WITH f, b, avg(RoomComfortLevel) AS FloorComfortLevel   // rooms  -> floor
WITH b,    avg(FloorComfortLevel) AS ComfortLevel        // floors -> building
Filtering on an aggregate. The floor-alert and building-alert queries place a WHERE after the aggregation — like SQL’s HAVING — so a floor or the building only shows up while its average is outside the comfortable band:
WITH f, avg(RoomComfortLevel) AS ComfortLevel
WHERE ComfortLevel < 40 OR ComfortLevel > 50
RETURN f.id AS FloorId, ComfortLevel
Because these are continuous queries, the aggregates are maintained incrementally: when one room’s reading changes, Drasi recomputes only the affected floor and building averages and emits just that change — it never rescans every room.
The Dashboard Reaction
reactions:
  - kind: dashboard
    id: building-comfort-dashboard
    queries:
      - building-comfort-ui
      - building-comfort-level-calc
      # ...
    port: 3000
    predefinedDashboards:
      - id: building-comfort
        name: Building Comfort
        widgets:
          # ...
The dashboard reaction subscribes to the queries and streams their changes to the browser over a WebSocket. A predefined dashboard is seeded on startup, so the layout is ready the first time you open it. Most of the panels are Markdown widgets that use the reaction’s Handlebars helpers (groupBy, each, gt/lt) to lay out the building from the building-comfort-ui rows, plus a KPI and gauge for the overall level and Markdown widgets for the alert lists. Because the queries only emit changes, the dashboard updates the instant a room’s comfort changes — no polling. The full set of widget types and configuration options is documented in Configure the Dashboard Reaction.
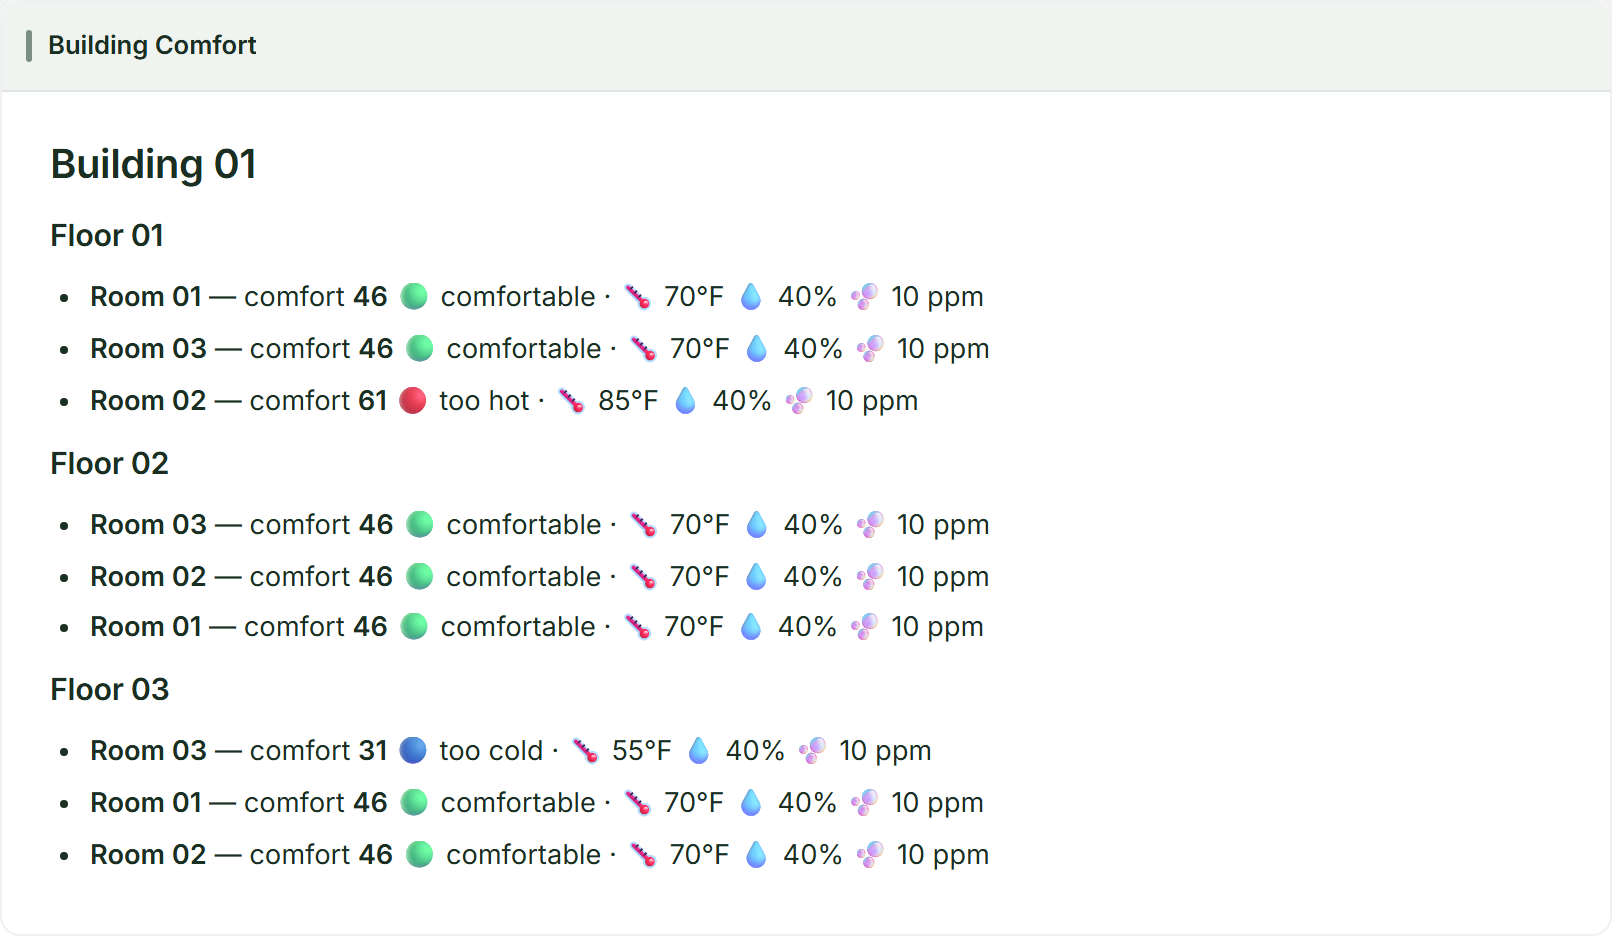
For example, the centerpiece Building Comfort panel is a single Markdown widget. Its template groups the building-comfort-ui rows by floor with groupBy, loops the rooms with each, and uses the gt/lt helpers to pick a status emoji per comfort level. Here is the widget’s template:
{{#groupBy rows "FloorName"}}
### {{@key}}
{{#each this}}
- **{{this.RoomName}}** — comfort **{{this.ComfortLevel}}**
    {{#if (gt this.ComfortLevel 50)}}
      🔴 too hot
    {{else}}
      {{#if (lt this.ComfortLevel 40)}}
        🔵 too cold
      {{else}}
        🟢 comfortable
      {{/if}}
    {{/if}}
    · 🌡️ {{this.Temperature}}°F  💧 {{this.Humidity}}%  🫧 {{this.CO2}} ppm
{{/each}}
{{/groupBy}}
And the reaction renders it live:
Build a Custom UI with the SSE Reaction
Prefer to build your own front end? The dashboard reaction is the fastest way to see a query, but Drasi Server can drive a fully custom UI just as easily through the SSE reaction (kind: sse). It streams the same query changes to the browser over Server-Sent Events, so any web app can subscribe with a few lines of JavaScript and render the results however you like:
const events = new EventSource("http://localhost:8081/events");
events.onmessage = (e) => {
  const { queryId, results } = JSON.parse(e.data);
  // Each result carries `before` and `after`; update your UI from `after`.
  for (const change of results) render(queryId, change.after);
};
Because the reaction pushes only what changed — never the full result set — your UI stays live without polling, powered by the same engine behind this dashboard but with complete control over the markup. The Getting Started tutorial wires up the SSE reaction step by step, and the Configure the SSE Reaction guide documents its full configuration.
You can also query Drasi Server’s REST API while the demo runs — see requests.http for ready-made requests, for example:
GET http://localhost:8380/api/v1/queries/building-comfort-ui/results
GET http://localhost:8380/api/v1/queries/room-alert/results
Clean Up
When you’re finished, stop Drasi Server with Ctrl+C in Terminal 1, then remove the database container:
# Stop containers, keep data
bash scripts/cleanup.sh

# Stop containers and delete the data volume
bash scripts/cleanup.sh --volumes
# Stop containers, keep data
powershell -ExecutionPolicy Bypass -File scripts/cleanup.ps1
# Stop containers and delete the data volume
powershell -ExecutionPolicy Bypass -File scripts/cleanup.ps1 -RemoveVolumesWhat You Learned
- Sources connect Drasi Server to live data — here, PostgreSQL via Change Data Capture.
- Continuous Queries with synthetic joins let you model relationships (room → floor → building) and compute derived values (comfort levels) that stay current automatically.
- Reactions turn query changes into action. The dashboard reaction gave you a live, configurable UI with zero application code — no bespoke web app required.
- Because Drasi emits only what changed, everything updates the instant the data does, with no polling.
From here, try editing the comfort formula or the dashboard widgets in server-config.yaml, adding a new alert query, or pointing the dashboard at your own data.
Feedback
Was this page helpful?
Glad to hear it! Please tell us what you found helpful.
Sorry to hear that. Please tell us how we can improve.