High Risk Containers
16 minute read
Imagine you keep a list of container images that are considered high risk (known vulnerabilities, compliance problems, images you simply don’t want in production), and you want to know, the instant it happens, whenever one of them is actually running in your Kubernetes cluster. You don’t want to write a controller, poll the API on a timer, or stand up a stream processor. You just want to describe the relationship between “risky images” and “running containers” and have something watch for the overlap, continuously.
This tutorial builds a High Risk Containers dashboard on Drasi Server. A PostgreSQL table holds the image tags you consider high risk, and a Kubernetes source watches the live Pods in a cluster. A single continuous query joins the two together, and Drasi Server’s built-in dashboard reaction renders the result live, with no application code and no bespoke web UI.
What you’ll build: a running Drasi Server that connects to PostgreSQL and Kubernetes and reacts to both in real time, assembled from Drasi’s three core building blocks:
| Step | What You’ll Do | Time |
|---|---|---|
| Step 1: Set Up Your Environment | Open the dev container (or install the tools locally) | 5 min |
| Step 2: Run the Demo | One command starts Kubernetes, PostgreSQL, and Drasi Server | 5 min |
| Step 3: Open the Dashboard | Watch high risk containers appear live | 2 min |
| Step 4: Drive Change | Flag a new image and upgrade a Pod, then watch Drasi react instantly | 5 min |
| How It Works | Understand the two sources, the unwind middleware, the synthetic join, and the dashboard | 5 min |
- Terminals: you’ll use two. Terminal 1 runs the demo (it stays in the foreground). Use Terminal 2 for the helper scripts that change data.
- Working directory: run every command from the tutorial directory (
tutorials/high-risk-containers/). The dev container opens there automatically; if you’re running locally,cd tutorials/high-risk-containersfirst. - Command tabs: commands are shown in tabs (bash / zsh and PowerShell). Use the one for your shell. The dev container and Codespaces use bash.
- Ports: the Drasi Server API is on
8380, the dashboard is on3000, PostgreSQL is published on5732, and the k3d Kubernetes API is on6550.
Step 1 of 4: Set Up Your Environment
This tutorial needs Docker (it runs both PostgreSQL and a local Kubernetes cluster), plus k3d and kubectl. The easiest way to get everything is the dev container.
Option A: Dev Container or GitHub Codespaces (recommended)
- Open this repository in VS Code and run Reopen in Container (or create a Codespace from the repo’s Code menu).
- When prompted for a configuration, choose Drasi Server - High Risk Containers Tutorial.
- Wait for the container to finish. Its setup script installs the PostgreSQL client,
kubectl, andk3d, and downloads the Drasi Server binary.
That’s it. Skip ahead to Step 2.
Option B: Run Locally
You’ll need Docker (for PostgreSQL and k3d), k3d, kubectl, and bash (the helper scripts use it; on Windows use Git Bash or WSL, or use the PowerShell tabs). From the repository root, move into the tutorial directory and download the Drasi Server binary:
cd tutorials/high-risk-containers
bash scripts/download.sh
cd tutorials/high-risk-containers
powershell -ExecutionPolicy Bypass -File scripts/download.ps1This places the binary at bin/drasi-server (or bin\drasi-server.exe on Windows) inside the tutorial directory.
Option C: Build from Source
Prefer to compile Drasi Server yourself? Follow the Build from Source installation guide to clone the repository and build the binary.
Once it is built, make the drasi-server binary available to this tutorial’s helper scripts — either add it to your PATH, or copy it into this tutorial’s bin/ directory (the same location Option B uses):
cd tutorials/high-risk-containers
mkdir -p bin
cp /path/to/drasi-server/bin/drasi-server bin/drasi-server
cd tutorials/high-risk-containers
New-Item -ItemType Directory -Force bin | Out-Null
Copy-Item C:\path\to\drasi-server\bin\drasi-server.exe bin\drasi-server.exeStep 2 of 4: Run the Demo
Everything runs from a single configuration file, server-config.yaml. In Terminal 1, start the demo:
bash scripts/start-demo.shpowershell -ExecutionPolicy Bypass -File scripts/start-demo.ps1The start-demo script does three things:
- Creates a k3d Kubernetes cluster and deploys two demo Pods (
my-app-1runningghcr.io/drasi-project/my-app:0.1andmy-app-2running:0.2), then writes a kubeconfig that Drasi Server uses to watch the cluster. - Starts PostgreSQL and seeds the
RiskyImagetable (it flagsmy-app:0.1as a Security Risk andredis:6.2.3-alpineas a Compliance Issue). - Runs Drasi Server in the foreground with the full configuration.
On first start, Drasi Server downloads the plugins it needs (source/postgres, bootstrap/postgres, source/kubernetes, bootstrap/kubernetes, reaction/dashboard) from ghcr.io/drasi-project and caches them under this tutorial’s bin/plugins directory, connects to both sources, bootstraps the existing rows and Pods, starts the continuous query, and starts the dashboard. When you see a line like the following, it’s ready:
Drasi Server started successfully with API on port 8380
Leave this running. Everything else happens from Terminal 2 (or your browser).
Press Ctrl+C in Terminal 1 to stop the server. To remove the database container and the k3d cluster when you’re completely done, run bash scripts/cleanup.sh (bash) or powershell -ExecutionPolicy Bypass -File scripts/cleanup.ps1 (PowerShell). Add --volumes (bash) or -RemoveVolumes (PowerShell) to also delete the database data.
Step 3 of 4: Open the Dashboard
Drasi Server’s dashboard reaction hosts a live web dashboard; there’s no separate app to build or run. Wait until Terminal 1 prints Drasi Server started successfully (on the first run this takes a little longer while the plugins download), then open it in your browser:
http://localhost:3000
In the dev container or Codespaces, port 3000 is forwarded automatically; VS Code shows a notification when the dashboard is ready, and you can also open it from the Ports panel (the High Risk Containers Dashboard entry). If you open the page before the server has finished starting, just refresh once it’s ready.
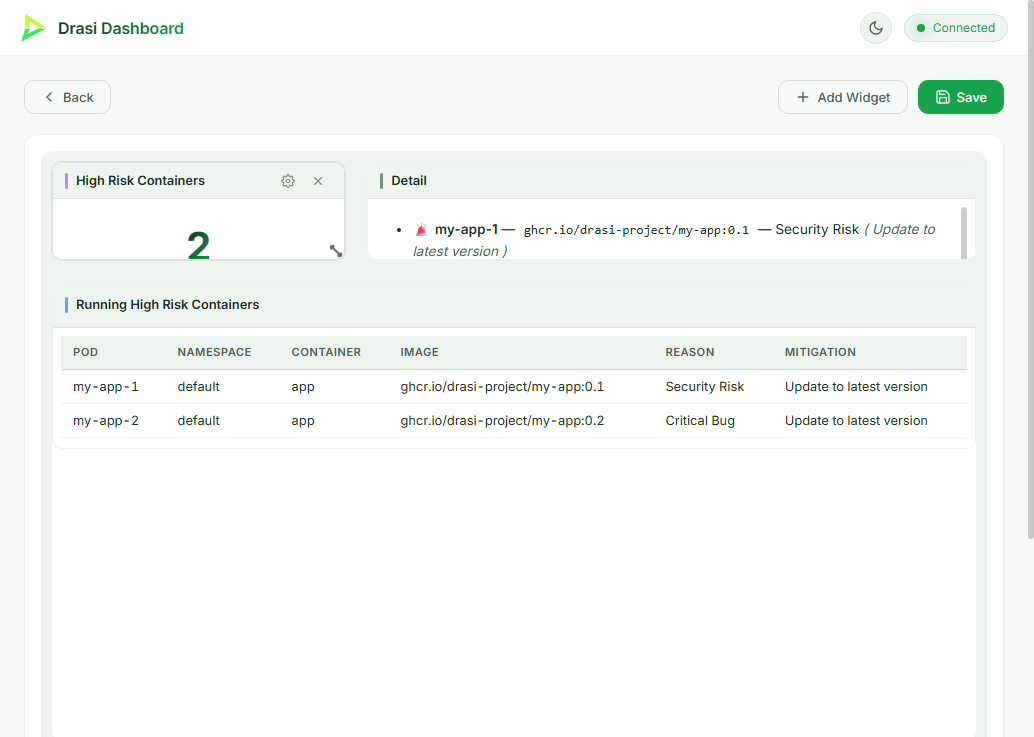
You’ll see the High Risk Containers dashboard:
- High Risk Containers KPI: how many running containers currently match a high risk image.
- Running High Risk Containers: the live table of pod, namespace, container, image, reason, and mitigation.
- Detail: a Markdown panel listing each finding (and an all-clear message when there are none).
To begin, exactly one container is flagged: my-app-1, running my-app:0.1, which the database lists as a Security Risk. The dashboard updates the instant the data changes, with no refreshing. Let’s make something change.
Step 4 of 4: Drive Change
With Terminal 1 running the demo and the dashboard open, use Terminal 2 to change the inputs and watch Drasi react.
Flag a new high risk image
my-app-2 is running my-app:0.2, but that image isn’t risky yet. Add it to the RiskyImage table:
docker exec -i high-risk-containers-postgres psql -U drasi_user -d high_risk_containers -c "INSERT INTO \"RiskyImage\" (\"Id\", \"Image\", \"Reason\", \"Mitigation\") VALUES (101, 'ghcr.io/drasi-project/my-app:0.2', 'Critical Bug', 'Update to latest version');"docker exec -i high-risk-containers-postgres psql -U drasi_user -d high_risk_containers -c 'INSERT INTO "RiskyImage" ("Id", "Image", "Reason", "Mitigation") VALUES (101, ''ghcr.io/drasi-project/my-app:0.2'', ''Critical Bug'', ''Update to latest version'');'Within about a second the dashboard reacts: my-app-2 appears in the table with reason Critical Bug, and the KPI ticks up to 2. Nothing restarted, and Drasi never polled; it saw the new database row through PostgreSQL’s logical replication and re-evaluated the join. (The add-risky-image.sh / .ps1 helper scripts run exactly this INSERT with sensible defaults if you prefer.)
Upgrade a Pod to a safe image
Now fix my-app-2 by upgrading it to :0.3, which isn’t on the risky list:
kubectl --kubeconfig bin/kubeconfig.yaml set image pod/my-app-2 app=ghcr.io/drasi-project/my-app:0.3kubectl --kubeconfig bin/kubeconfig.yaml set image pod/my-app-2 app=ghcr.io/drasi-project/my-app:0.3Once the Pod is running the new image, my-app-2 disappears from the table and the KPI drops back to 1; Drasi saw the Pod change through the Kubernetes watch and removed the row from the result set automatically. (The upgrade-pod.sh / .ps1 helper scripts run this same kubectl set image and then wait for the Pod to be ready.)
Reset
Return everything to the starting state (removes the image you added and puts the Pods back on their original tags):
bash scripts/reset.shpowershell -ExecutionPolicy Bypass -File scripts/reset.ps1How It Works
Everything you just ran is described by the single server-config.yaml. Here’s what each part does.
Two Sources
The query joins data from two different systems, so the configuration declares two sources.
PostgreSQL holds the list of risky images and streams changes via logical replication (CDC):
sources:
  - kind: postgres
    id: devops
    # ... connection settings ...
    tables:
      - RiskyImage
    tableKeys:
      - table: RiskyImage
        keyColumns:
          - Id
    bootstrapProvider:
      kind: postgres
The table name and columns are quoted and PascalCase ("RiskyImage", "Image", "Reason", "Mitigation") so the node label and properties Drasi sees match the Cypher query ((i:RiskyImage) with i.Image, i.Reason, i.Mitigation) without any change to the query text.
Kubernetes watches the live Pods. Drasi Server runs outside the cluster and connects with a kubeconfig file:
  - kind: kubernetes
    id: k8s
    resources:
      - apiVersion: v1
        kind: Pod
    namespaces:
      - default
    authMode: kubeconfig
    kubeconfigPath: bin/kubeconfig.yaml
    bootstrapProvider:
      kind: kubernetes
Each Kubernetes object becomes a graph node whose properties mirror that object’s representation in the Kubernetes API: the same field names and nested structure you’d see in kubectl get pod -o json. So a Pod node’s containers property is the API’s spec.containers array: one entry per container, each with its name, image, ports, resources, and so on. Frequently used metadata such as name and namespace are also promoted to the top level for convenience. Because the shape matches the API, you can navigate any field in Cypher exactly as it appears in kubectl ... -o json. That containers array is the key to the join. (scripts/setup-cluster.sh writes the kubeconfig to bin/kubeconfig.yaml, and the start scripts launch Drasi Server from the tutorial directory so that relative path resolves.)
The Unwind Middleware
The risky-image list is keyed by image, but a Pod can run several containers. To compare them, the query first unwinds each Pod’s containers array, promoting every entry to its own Container node linked back to the Pod by an OWNS relation:
middleware:
  - kind: unwind
    name: extract-containers
    config:
      Pod:
        - selector: $.containers[*]   # each entry in the Pod's containers list
          label: Container            # becomes a node with this label
          key: $.name                 # unique within the Pod
          relation: OWNS              # Pod -[:OWNS]-> Container
The middleware is attached to the Kubernetes subscription with a pipeline, so every incoming Pod change is pre-processed before the query sees it:
sources:
  - sourceId: k8s
    nodes:
      - Pod
    pipeline:
      - extract-containers
  - sourceId: devops
    nodes:
      - RiskyImage
The Synthetic Join
PostgreSQL and Kubernetes know nothing about each other, so the query declares the relationship that connects them. The HAS_IMAGE synthetic join matches a Container’s image to a RiskyImage’s Image:
joins:
  - id: HAS_IMAGE
    keys:
      - label: Container
        property: image
      - label: RiskyImage
        property: Image
With the unwind relation and the synthetic join in place, the Cypher walks straight from Pod to Container to risky image and returns exactly the running containers that overlap the risky list:
MATCH
  (p:Pod)-[:OWNS]->(c:Container)-[:HAS_IMAGE]->(i:RiskyImage)
RETURN
  p.name AS pod,
  p.namespace AS namespace,
  c.name AS container,
  c.image AS image,
  i.Reason AS reason,
  i.Mitigation AS mitigation
Because this is a continuous query, the result set is maintained incrementally: add a row to RiskyImage and a matching Pod appears; change a Pod’s image and it drops out, each as a single change, with no rescans and no polling.
The query, assembled
Put those pieces together and here is the complete query definition exactly as it appears in server-config.yaml: the source subscriptions (with the unwind pipeline), the synthetic join, the unwind middleware, and the Cypher, all under one queries entry:
queries:
  - id: high-risk-containers
    autoStart: true
    queryLanguage: Cypher

    # The sources this query subscribes to, and the labels it consumes from each.
    sources:
      - sourceId: k8s
        nodes:
          - Pod
        # Run incoming Pod changes through the unwind middleware.
        pipeline:
          - extract-containers
      - sourceId: devops
        nodes:
          - RiskyImage

    # Declare the synthetic join the query walks with [:HAS_IMAGE].
    joins:
      - id: HAS_IMAGE
        keys:
          - label: Container
            property: image
          - label: RiskyImage
            property: Image

    # Pre-process Pod changes: unwind $.containers[*] into Container nodes.
    middleware:
      - kind: unwind
        name: extract-containers
        config:
          Pod:
            - selector: $.containers[*]
              label: Container
              key: $.name
              relation: OWNS

    query: |
      MATCH
        (p:Pod)-[:OWNS]->(c:Container)-[:HAS_IMAGE]->(i:RiskyImage)
      RETURN
        p.name AS pod,
        p.namespace AS namespace,
        c.name AS container,
        c.image AS image,
        i.Reason AS reason,
        i.Mitigation AS mitigation
The Dashboard Reaction
reactions:
  - kind: dashboard
    id: high-risk-containers-dashboard
    queries:
      - high-risk-containers
    port: 3000
    predefinedDashboards:
      - id: high-risk-containers
        name: High Risk Containers
        widgets:
          # KPI (count), table, and a Markdown detail panel
          # ...
The dashboard reaction subscribes to the query and streams its changes to the browser over a WebSocket. A predefined dashboard is seeded on startup, so the layout is ready the first time you open it: a KPI counts the matching rows, a table lists them, and a text (Markdown) widget renders a human-friendly detail panel, or an all-clear message when the result set is empty. Because the query only emits changes, the dashboard updates the instant a Pod or the risky list changes. The full set of widget types and options is documented in Configure the Dashboard Reaction.
The widgets themselves are simple. The Running High Risk Containers table, for example, is a single table widget that names the query to read and the columns to show:
- id: risky-table
  type: table
  title: Running High Risk Containers
  grid: { x: 0, y: 2, w: 12, h: 8 }
  config:
    queryId: high-risk-containers
    columns:
      - pod
      - namespace
      - container
      - image
      - reason
      - mitigation
Each column is one of the fields the query returns, and grid places the widget on the dashboard’s 12-column layout. As containers appear and disappear, the reaction adds and removes table rows in place, with no page reload.
You can also query Drasi Server’s REST API while the demo runs; see requests.http for ready-made requests, for example:
GET http://localhost:8380/api/v1/queries/high-risk-containers/results
Optional: Discord Alerts
The dashboard is great for watching, but you often want to be notified: pushed a message the instant a high risk container appears. Drasi Server’s HTTP reaction (kind: http) turns query changes into outbound webhooks, so you can post straight into a Discord channel with no extra code. This step is optional and needs a Discord server where you can create a webhook.
The reaction is already written for you in server-config.yaml; it just ships commented out, so the base demo stays focused on the dashboard. Enabling it is a matter of uncommenting it and supplying a webhook URL.
This step continues from the demo you started in Step 2, so make sure Drasi Server is still running in Terminal 1 (and the database and cluster are still up) before you begin.
This uses Discord, but the HTTP reaction posts to any webhook-style endpoint (Slack, Microsoft Teams, PagerDuty, your own service) by changing the URL and the message template.
1. Create a Discord webhook
In Discord: Server Settings → Integrations → Webhooks → New Webhook, pick the channel, and Copy Webhook URL. It looks like https://discord.com/api/webhooks/<id>/<token>.
2. Enable the HTTP reaction in server-config.yaml
Open server-config.yaml and uncomment two things (remove the leading # from each line):
-
The HTTP reaction plugin in the
plugins:list, so it is installed on the next start:- ref: reaction/dashboard - ref: reaction/http # uncomment this line -
The
discord-alertsreaction block at the bottom of thereactions:section. It subscribes to the samehigh-risk-containersquery and renders a Discord message for each container that appears (added) and each one that is resolved (deleted):- kind: http id: discord-alerts autoStart: true queries: - high-risk-containers # The Discord webhook URL, supplied via an environment variable. baseUrl: "${DISCORD_WEBHOOK_URL}" timeoutMs: 30000 outputTemplates: routes: high-risk-containers: added: method: POST headers: Content-Type: application/json template: | { "content": "🚨 **High risk container detected**\n• **Pod:** `{{after.pod}}` (namespace `{{after.namespace}}`)\n• **Container:** `{{after.container}}`\n• **Image:** `{{after.image}}`\n• **Reason:** {{after.reason}}\n• **Mitigation:** {{after.mitigation}}" } deleted: method: POST headers: Content-Type: application/json template: | { "content": "✅ **High risk container resolved**\n• **Pod:** `{{before.pod}}`\n• **Image:** `{{before.image}}`" }
How this reaction works:
baseUrlis the full Discord webhook URL;${DISCORD_WEBHOOK_URL}is resolved from the environment at startup, so no secret is committed to the file. (Each call’surldefaults to empty, so requests POST tobaseUrlas-is.)templateis a Handlebars template rendered to the request body.addedtemplates read the new row via{{after.*}};deletedtemplates read the removed row via{{before.*}}. The fields (pod,namespace,container,image,reason,mitigation) are exactly what the query returns.- The body is Discord’s webhook format (
{"content": "..."}), where\nbecomes a line break in the posted message.
3. Provide the webhook URL and restart
Stop Drasi Server with Ctrl+C in Terminal 1, set the webhook URL in that same terminal, and start it again:
export DISCORD_WEBHOOK_URL="https://discord.com/api/webhooks/<id>/<token>"
bash scripts/start-server.sh
$env:DISCORD_WEBHOOK_URL = "https://discord.com/api/webhooks/<id>/<token>"
powershell -ExecutionPolicy Bypass -File scripts/start-server.ps1On this start, Drasi Server installs the reaction/http plugin and brings up the discord-alerts reaction alongside the dashboard. (The cluster and database are still running, so use start-server, not start-demo; the latter would reset the database.)
4. See it in action
From Terminal 2, drive a change and watch your Discord channel:
# A high risk container appears -> 🚨 message in Discord
docker exec -i high-risk-containers-postgres psql -U drasi_user -d high_risk_containers -c "INSERT INTO \"RiskyImage\" (\"Id\", \"Image\", \"Reason\", \"Mitigation\") VALUES (101, 'ghcr.io/drasi-project/my-app:0.2', 'Critical Bug', 'Update to latest version');"

# Resolve it by upgrading the pod -> ✅ message in Discord
kubectl --kubeconfig bin/kubeconfig.yaml set image pod/my-app-2 app=ghcr.io/drasi-project/my-app:0.3
# A high risk container appears -> 🚨 message in Discord
docker exec -i high-risk-containers-postgres psql -U drasi_user -d high_risk_containers -c 'INSERT INTO "RiskyImage" ("Id", "Image", "Reason", "Mitigation") VALUES (101, ''ghcr.io/drasi-project/my-app:0.2'', ''Critical Bug'', ''Update to latest version'');'
# Resolve it by upgrading the pod -> ✅ message in Discord
kubectl --kubeconfig bin/kubeconfig.yaml set image pod/my-app-2 app=ghcr.io/drasi-project/my-app:0.3The first command flags my-app:0.2; Drasi joins it to the running my-app-2 pod and posts a 🚨 alert. The second upgrades that pod to the safe :0.3 tag, dropping it from the result set and posting a ✅ resolution. Run reset.sh afterwards to return to the starting state.
Clean Up
When you’re finished, stop Drasi Server with Ctrl+C in Terminal 1, then remove the database container and the k3d cluster:
# Stop containers + cluster, keep data
bash scripts/cleanup.sh

# Stop containers + cluster and delete the database volume
bash scripts/cleanup.sh --volumes
# Stop containers + cluster, keep data
powershell -ExecutionPolicy Bypass -File scripts/cleanup.ps1
# Stop containers + cluster and delete the database volume
powershell -ExecutionPolicy Bypass -File scripts/cleanup.ps1 -RemoveVolumesWhat You Learned
- Multi-source queries let Drasi join data that lives in completely different systems (here, a PostgreSQL table and a live Kubernetes cluster) with no glue code.
- The unwind middleware turns a nested array (a Pod’s containers) into first-class graph nodes you can match and join.
- Synthetic joins declare relationships across sources, so a single Cypher query can walk from Pod to container to risky image.
- The dashboard reaction gave you a live, configurable UI with zero application code, and no bespoke web app required.
- The optional HTTP reaction pushed those same changes straight to a Discord channel as webhooks; the same pattern works for Slack, Teams, or any HTTP endpoint.
- Because Drasi emits only what changed, the dashboard updates the instant a Pod or the risky-image list changes, with no polling.
From here, try watching more resource types, flagging your own images, adding columns to the query, or editing the dashboard widgets in server-config.yaml.
Feedback
Was this page helpful?
Glad to hear it! Please tell us what you found helpful.
Sorry to hear that. Please tell us how we can improve.