Building Comfort with Drasi
25 minute read
Scenario
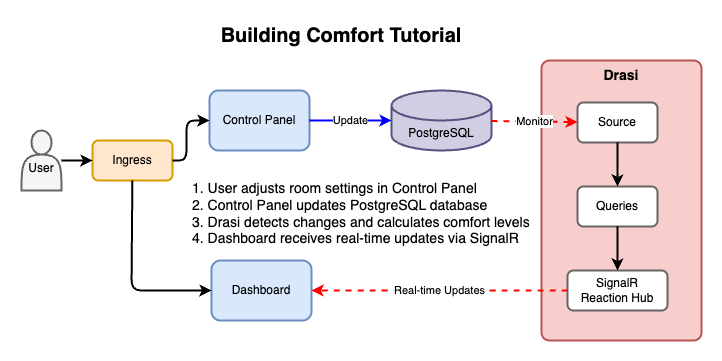
Let’s consider a building management scenario where we have buildings with several floors, with each floor having several rooms. Each room has sensors that measure the following:
- Temperature
- CO2 levels
- Humidity
Each sensor logs its latest reading to a datastore.
In this scenario, the Comfort Level for each room is computed using the formula:
comfortLevel = trunc(50 + (temp - 72) + (humidity - 42) + if(CO2 > 500, (CO2 - 500) / 25, 0))
A range of 40 to 50 is considered acceptable: a value below 40 indicates that temperature and/or humidity is too low, while a value above 50 indicates that temperature, humidity, and/or CO2 levels are too high.
Building a reactive dashboard
What would it take to build a reactive front end dashboard that would alert us if the comfort level of any floor, room or building goes out of the acceptable range of [40, 50]?
What if we could not modify the existing system in place?
Traditional Approaches
There could be multiple ways to solve this problem, some of which are listed below:
We could build an event driven architecture to build the dashboard.
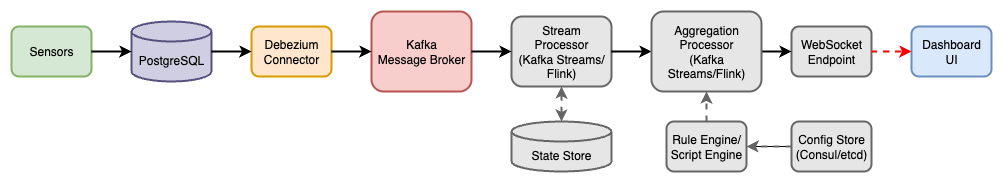
- Sensor values are published as messages/events to a message broker (e.g., Kafka).
- If sensor is already writing to a store that has a change-log, we can push the log events to the message broker using platforms like Debezium.
- If not, we could consider writing custom Kafka Connect source that queries database for changes and transforms results into Kafka records.
- A stream processor subscribes to the sensor topics and runs calculations through a rule engine or scripting engine.
- This stream processor needs to maintain state to store previously values for metrics that did not change. For instance, an event with updated Co2 value still needs the existing values for temperature & humidity. Alternatively, the sensors can emit a snapshot of all readings together.
- Stream processors can be defined as declarative queries using SQL-like DSLs such as Kafka-Streams/KSQL or Flink SQL.
- The engine can load the comfort level formula from a central config store (e.g., a key-value store like Consul or etcd).
- Another stream processor (or set of stream processing queries in Kafka Streams/Flink) listens to computed comfort levels and aggregates them per room, floor, and building.
- Push to UI: The aggregated results are published to a WebSocket endpoint or a real-time query endpoint that the dashboard subscribes to.
Pros:
- Highly reactive, event-driven flows.
- Dynamic and easily changeable logic through declarative queries.
- Real-time updates to the dashboard.
Cons:
- More moving parts (message broker, stream processors, rule engines).
- Complexity in operating and maintaining the system.
We can also take a Microservices based approach to this problem.
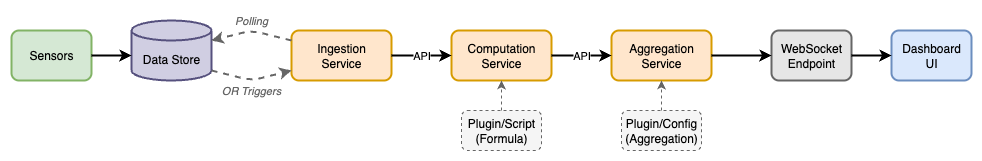
- Data Store: All sensors must write their latest value to a data store.
- Ingestion Service: Collects raw sensor data from the data source. This data could be polled from the data source, or we could have triggers in the data store which can call an API of the ingestion service.
- Computation Service: Reads raw data and applies a formula. The formula could be in a plugin or loaded as a Python/Lua/JS script at runtime.
- Aggregation Service: Aggregates using plugins or configuration-based strategies.
- Push to UI: The aggregated results are published to a WebSocket endpoint or a real-time query endpoint that the dashboard subscribes to.
Pros:
- Separation of concerns in microservices.
- Updating logic involves modifying a small plugin file or configuration, not the entire service.
- Scales well as the number of buildings/floors increases.
Cons:
- If ingestion services polls the data source, a question of the correct polling frequency arises.
- If ingestion service is invoked by triggers in the data source, we then need changes in existing system and not all data sources might support triggers.
- Managing multiple services and their deployments comes with operational complexity.
- Need a mechanism to ensure plugin changes are safely deployed and versioned.
- Coordination between services may be more complex.
An alternative approach could involve using serverless functions.
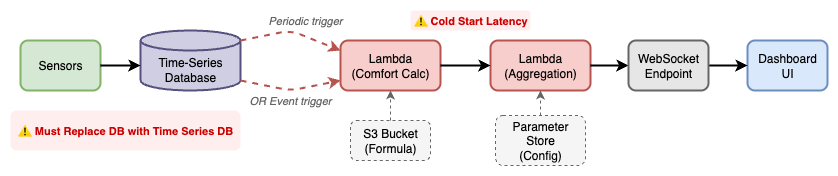
- Store all sensor data in a time-series database.
- Define a serverless function (e.g., AWS Lambda, Azure Function) triggered periodically or by new data events calculates comfort level.
- The formula could be read from an S3 file, a parameter store, or a database table.
- Define separate functions for Aggregation - it can also reads its aggregation logic from a config source.
- Push to UI: The aggregated results are published to a WebSocket endpoint or a real-time query endpoint that the dashboard subscribes to.
Pros:
- Very modular and easy to scale.
- Configuration-driven logic adjustments.
- Minimal code changes required, mostly config updates.
Cons:
- Potentially higher latency due to function cold starts.
- Complex logic might require careful management of state and configs.
- Requires changing existing data store to one usable by Serverless functions.
Issues with Traditional Approaches
All of the approaches discussed so far have the following issues:
Modifications to existing systems
Many of the approaches discussed previously can require changes to the existing systems which, in the real world, may often be deemed too risky or simply not feasible.
- In event driven approach, we could use a changelog-connector for database that can get the changes into a message broker.
- In microservices approach, we need an ingestion service to which data changes must be pushed by some component.
- In serverless approach, we might require a specific type of data store compatible with serverless functions.
Implementation & Operational Overhead
To implement a reactive dashboard using any approach, following are things that will be required regardless of the approach we take:
- Some mechanism to push updates to the UI as they happen in the real world. For example, a SignalR hub.
- Something that pushes DB changes to our systems. For example, in the event driven scenario, we could use a Debezium connector to push the database changelog to message broker.
- We will also need a way to describe the comfort-level formulas and the alerting criterion (preferably in a declarative manner).
Beyond that, any additional components add implementation and operational overhead:
-
In the event-driven approach, we need to deploy and maintain a message broker (like Kafka) and its paraphernalia. We also need to have a Stream Processing Engine running (or an embedded stream processor).
-
With microservices approach, we add a significant overhead in implementing, deploying and maintaining multiple services and the communication channels between them. There are also questions about consistency across services that can arise.
-
Serverless approach may not work due to cold starts impacting the reactiveness of the dashboard.
Enter Drasi
What if we had a platform where we could make our existing systems reactive - without writing any code?
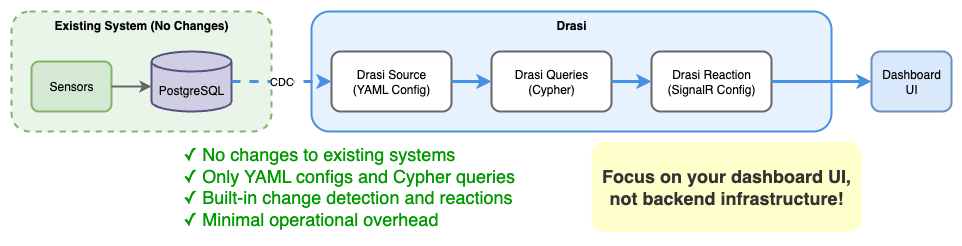
With Drasi, we can detect changes in our existing data source, write complicated alerting logic declaratively and get a reaction pushing those changes to our UI without writing any code.
Following is all we need to do to get a SignalR hub up and running:
- YAML file describing existing data source.
- YAML file(s) containing any alerts or computation logic (written in a
declarative
Cypherquery). - YAML file describing the reaction we want - in this case a SignalR hub which will push updates to our UI.
This means, we can spend more time in focusing on how the dashboard UI will look, rather than worrying about implementing and operating new backend infrastructure.
Building Comfort with Drasi
The rest of this tutorial will guide us in setting up a mock building management scenario and demonstrate how we can get a Reactive Dashboard built for existing systems with just some config files and Cypher queries.
Tutorial Modes
You can follow along the steps below in a Github codespace, a VSCode Dev Container or on a local k3d cluster on your machine.
The easiest way to follow along with this tutorial is to launch a Github Codespace using the link below. This will allow you to run the example application within your browser without setting up anything on your own machines.
![]()
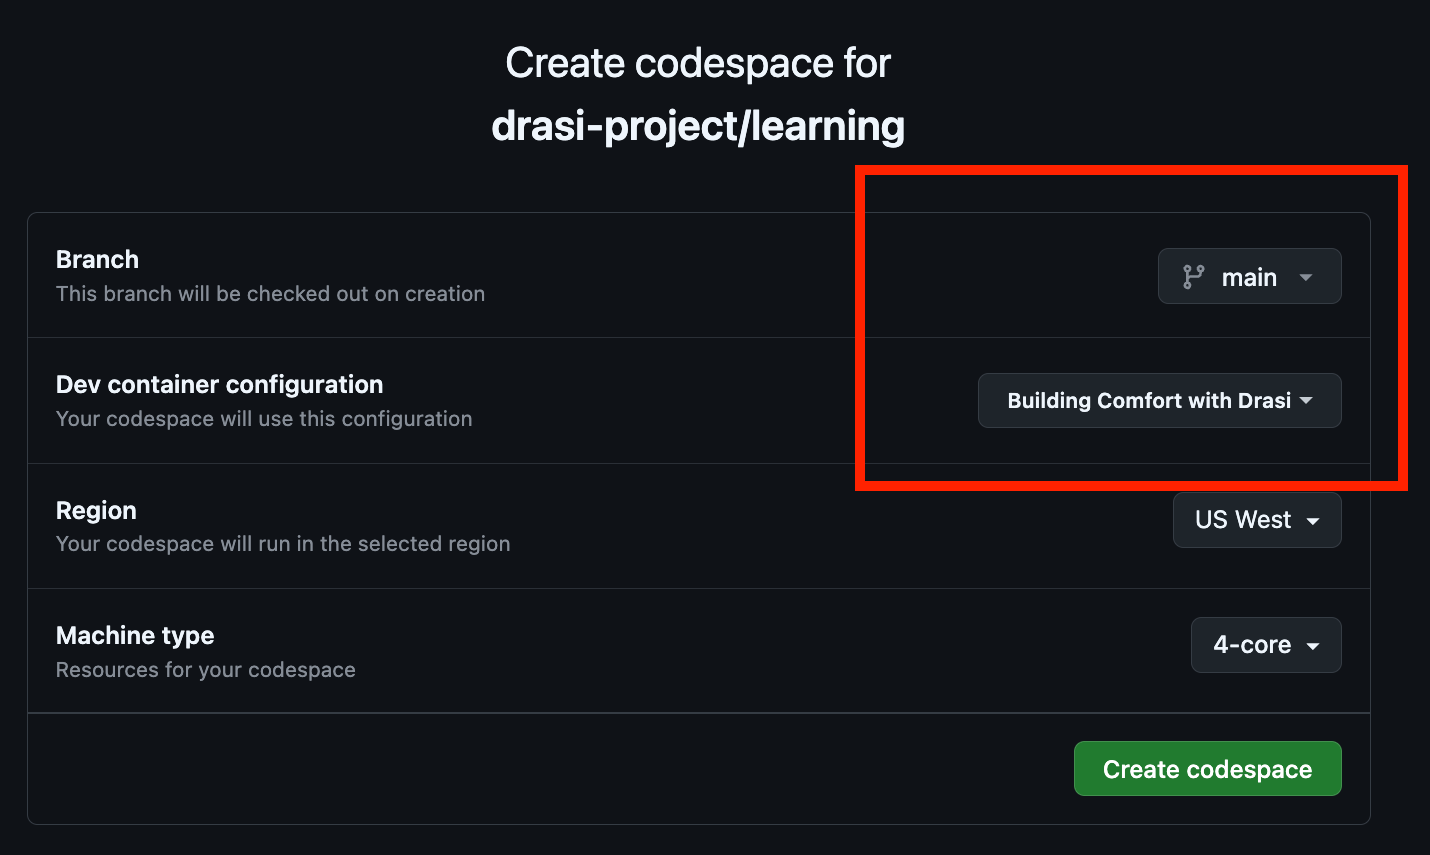
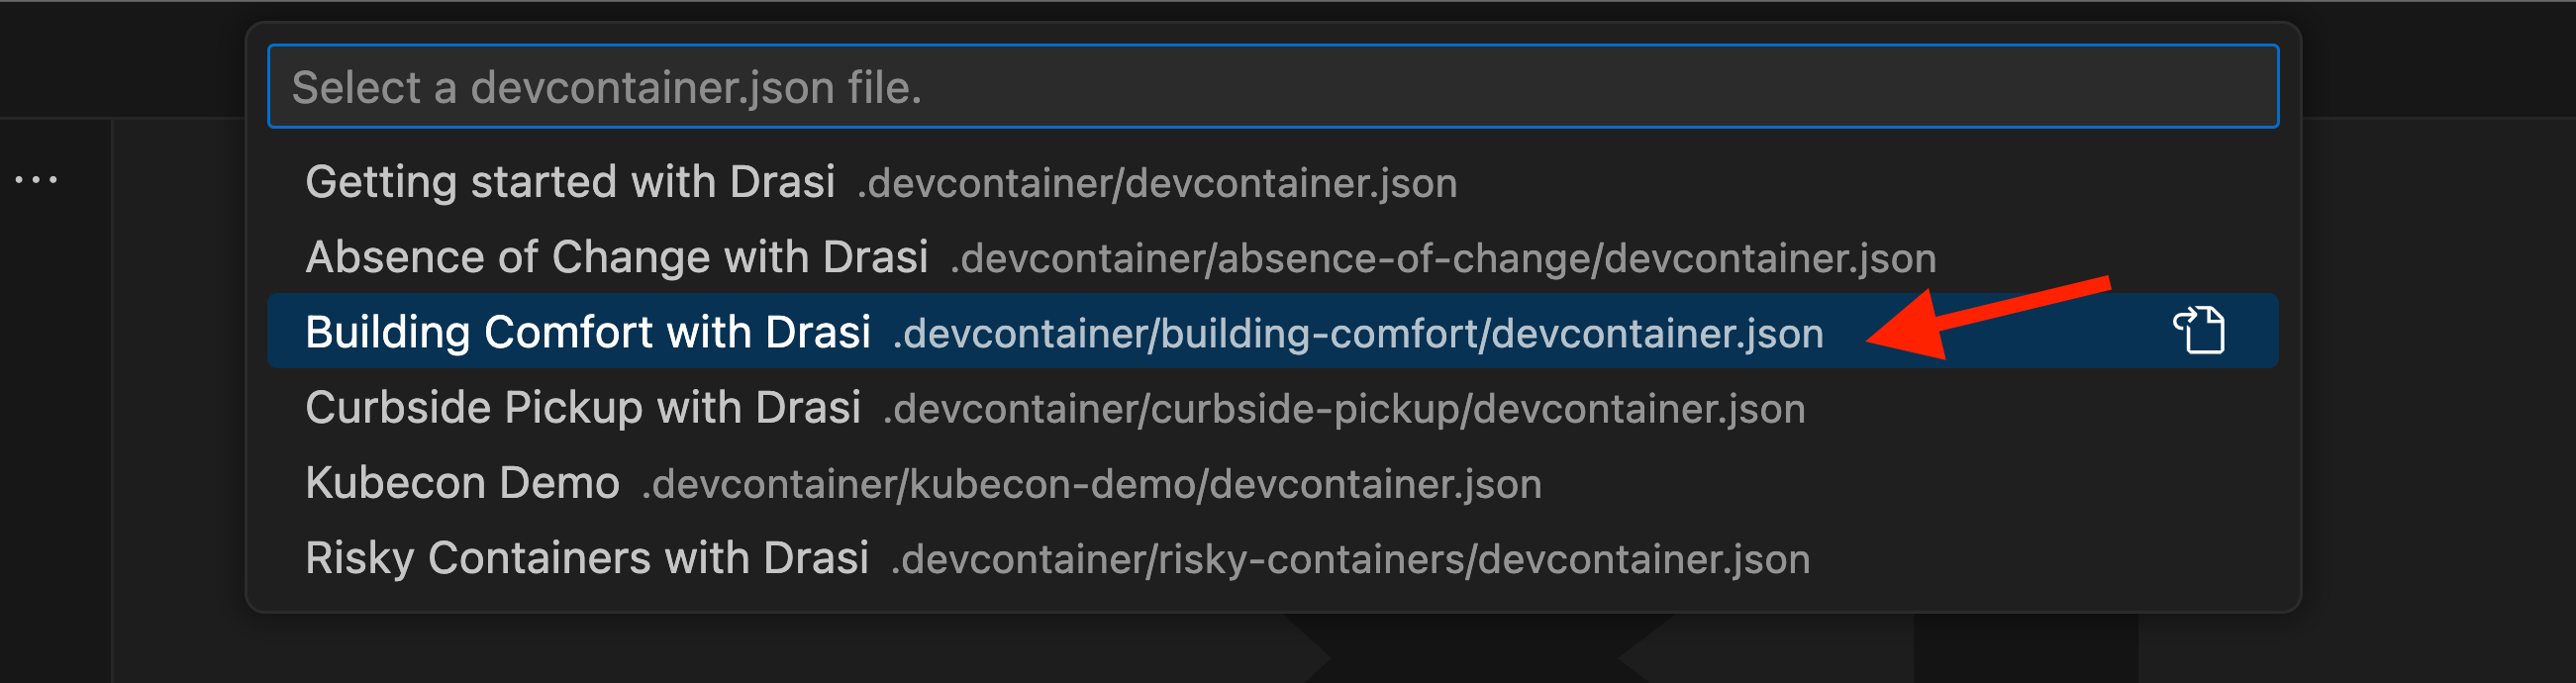
This will open a page with some configuration options. Make sure that the
‘Branch’ selected is main and set the ‘Dev Container configuration’ to
‘Building Comfort with Drasi’.
Note: The codespace will launch and run some setup scripts. Please wait for the scripts to complete. This should take less than 5 minutes to complete.
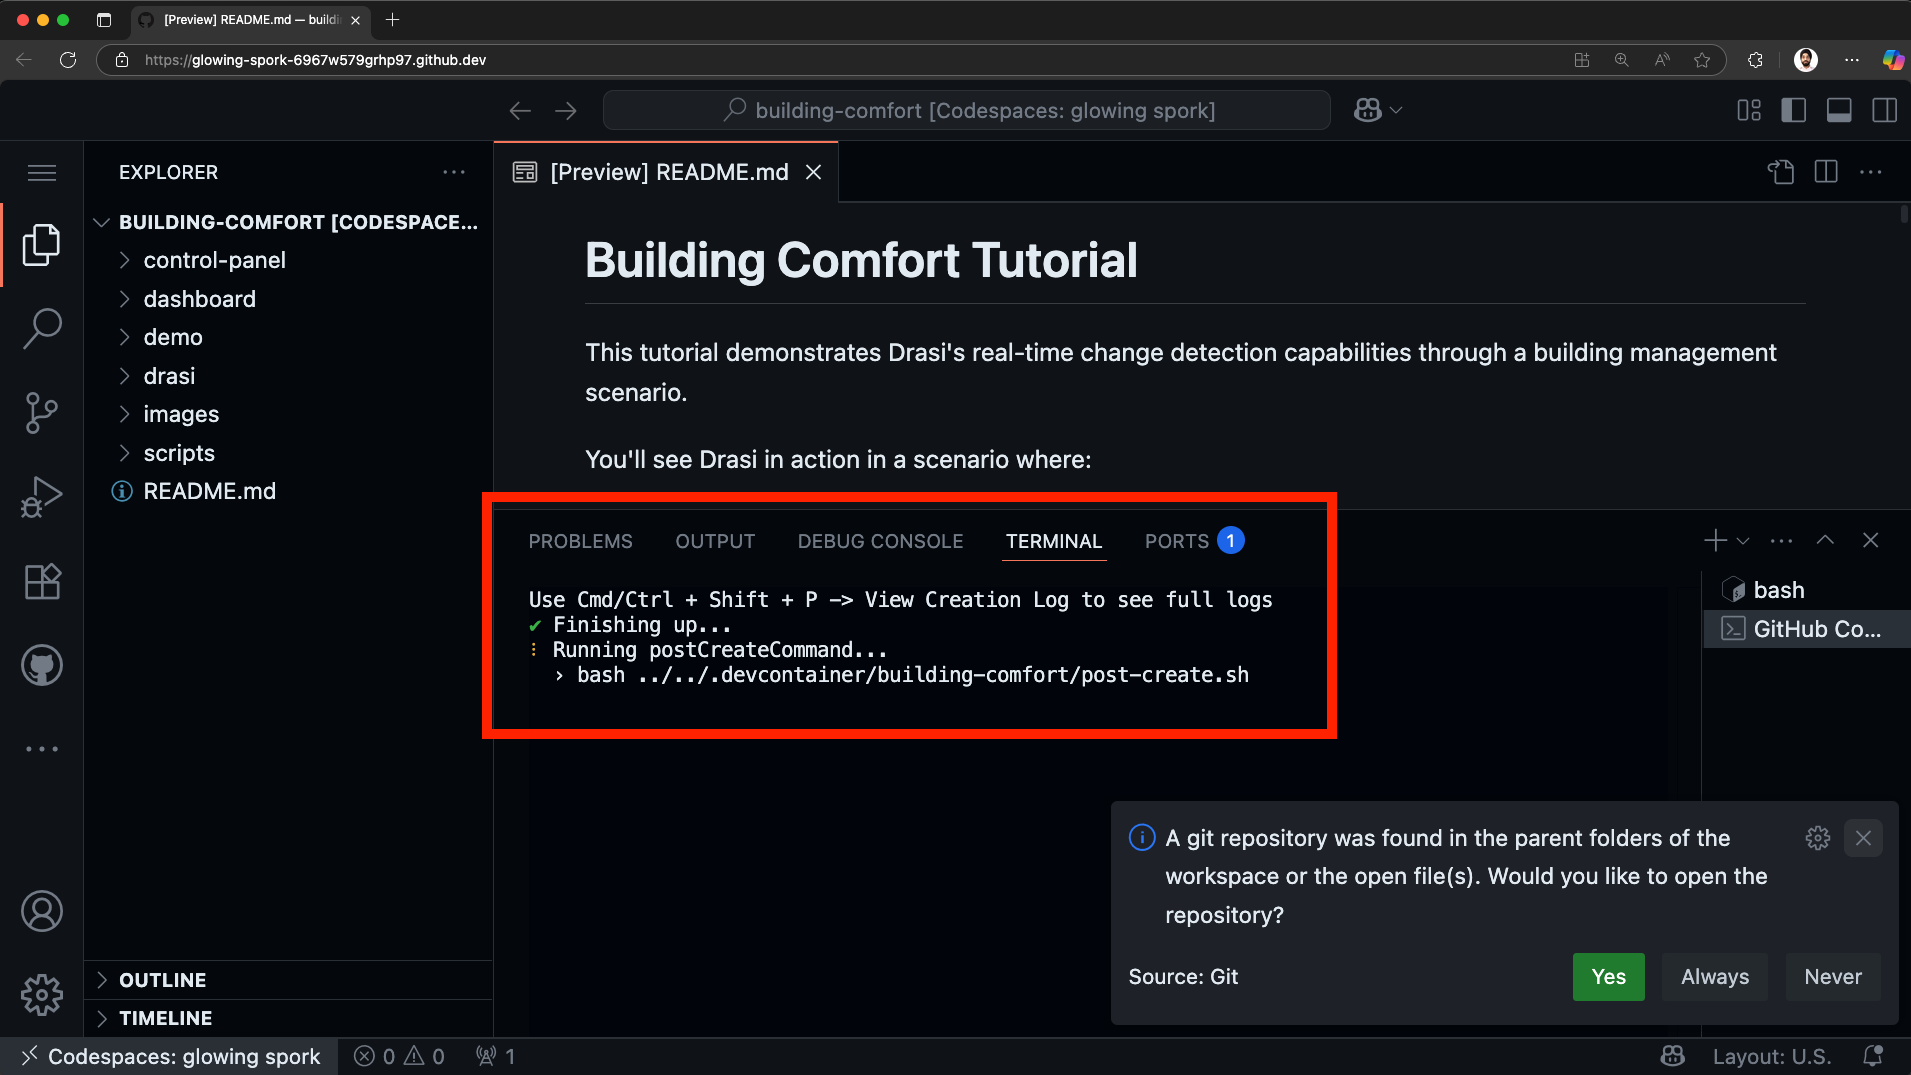
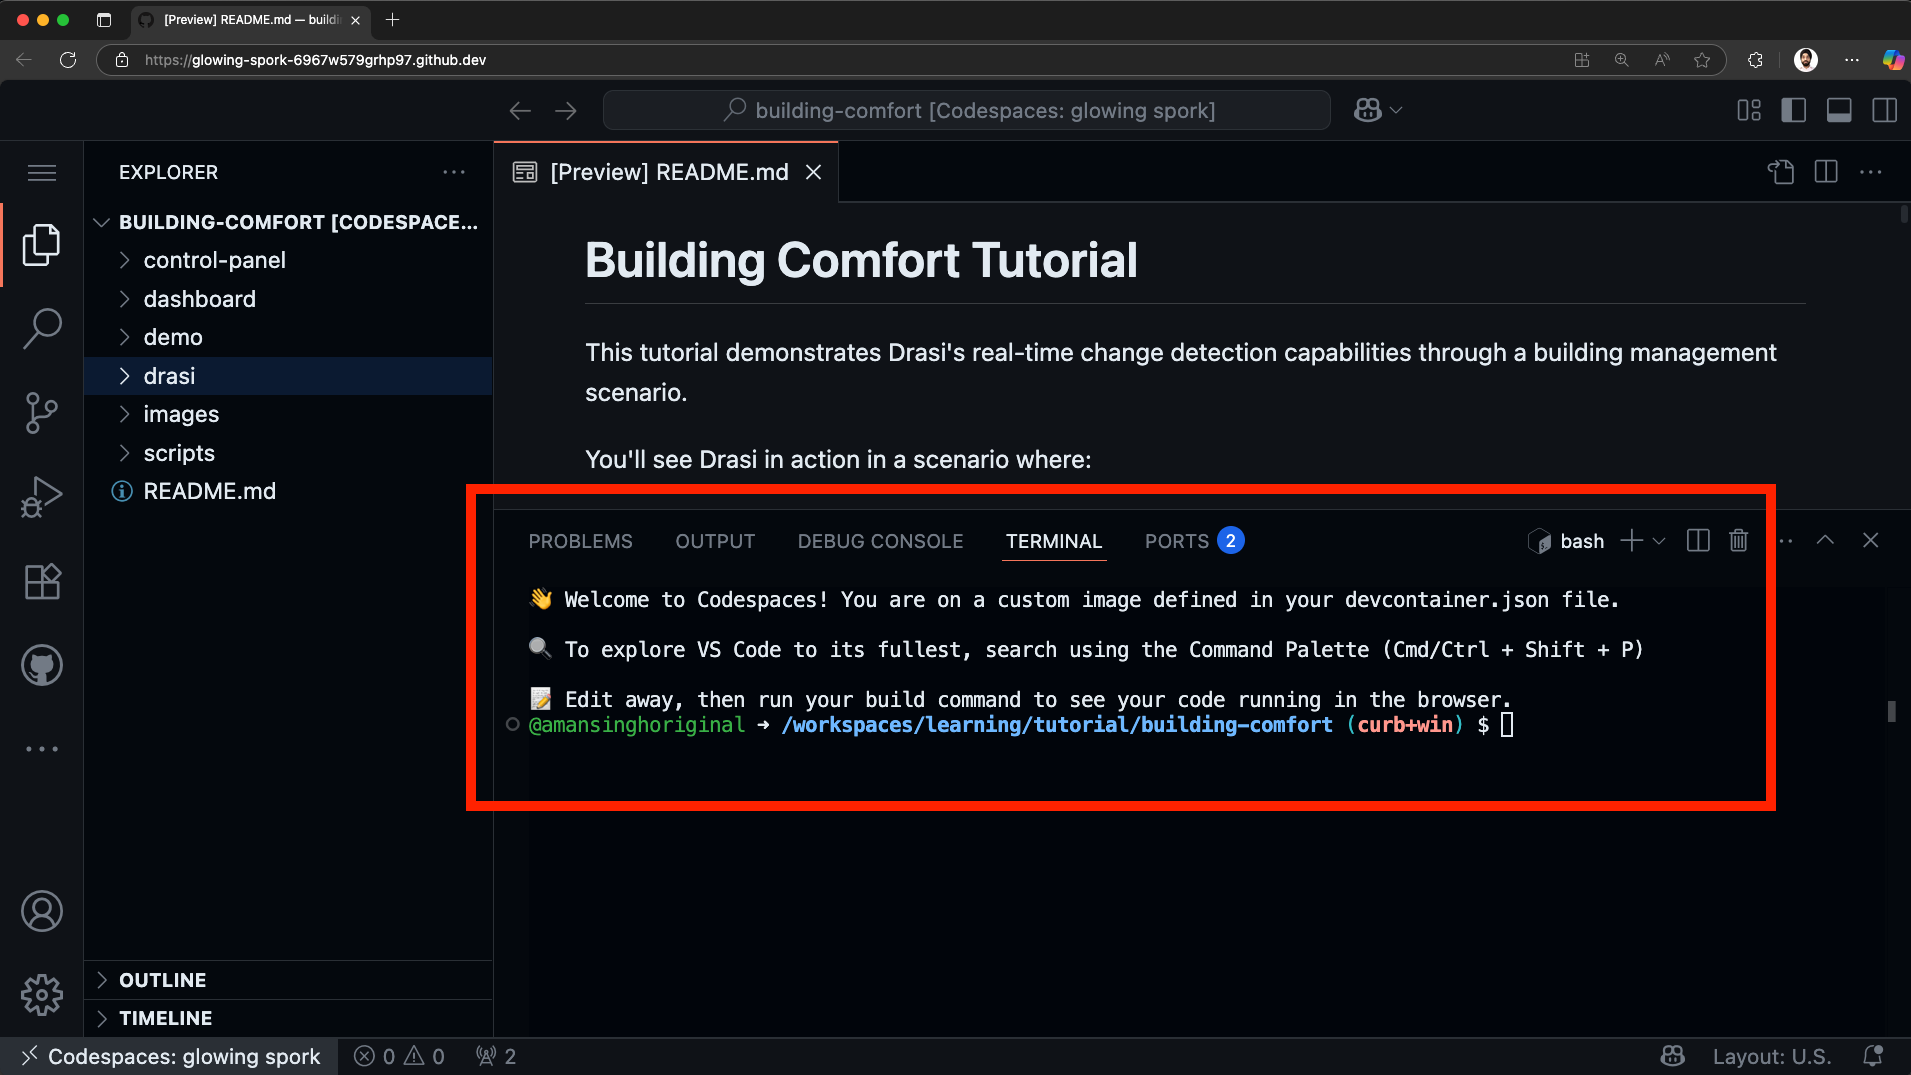
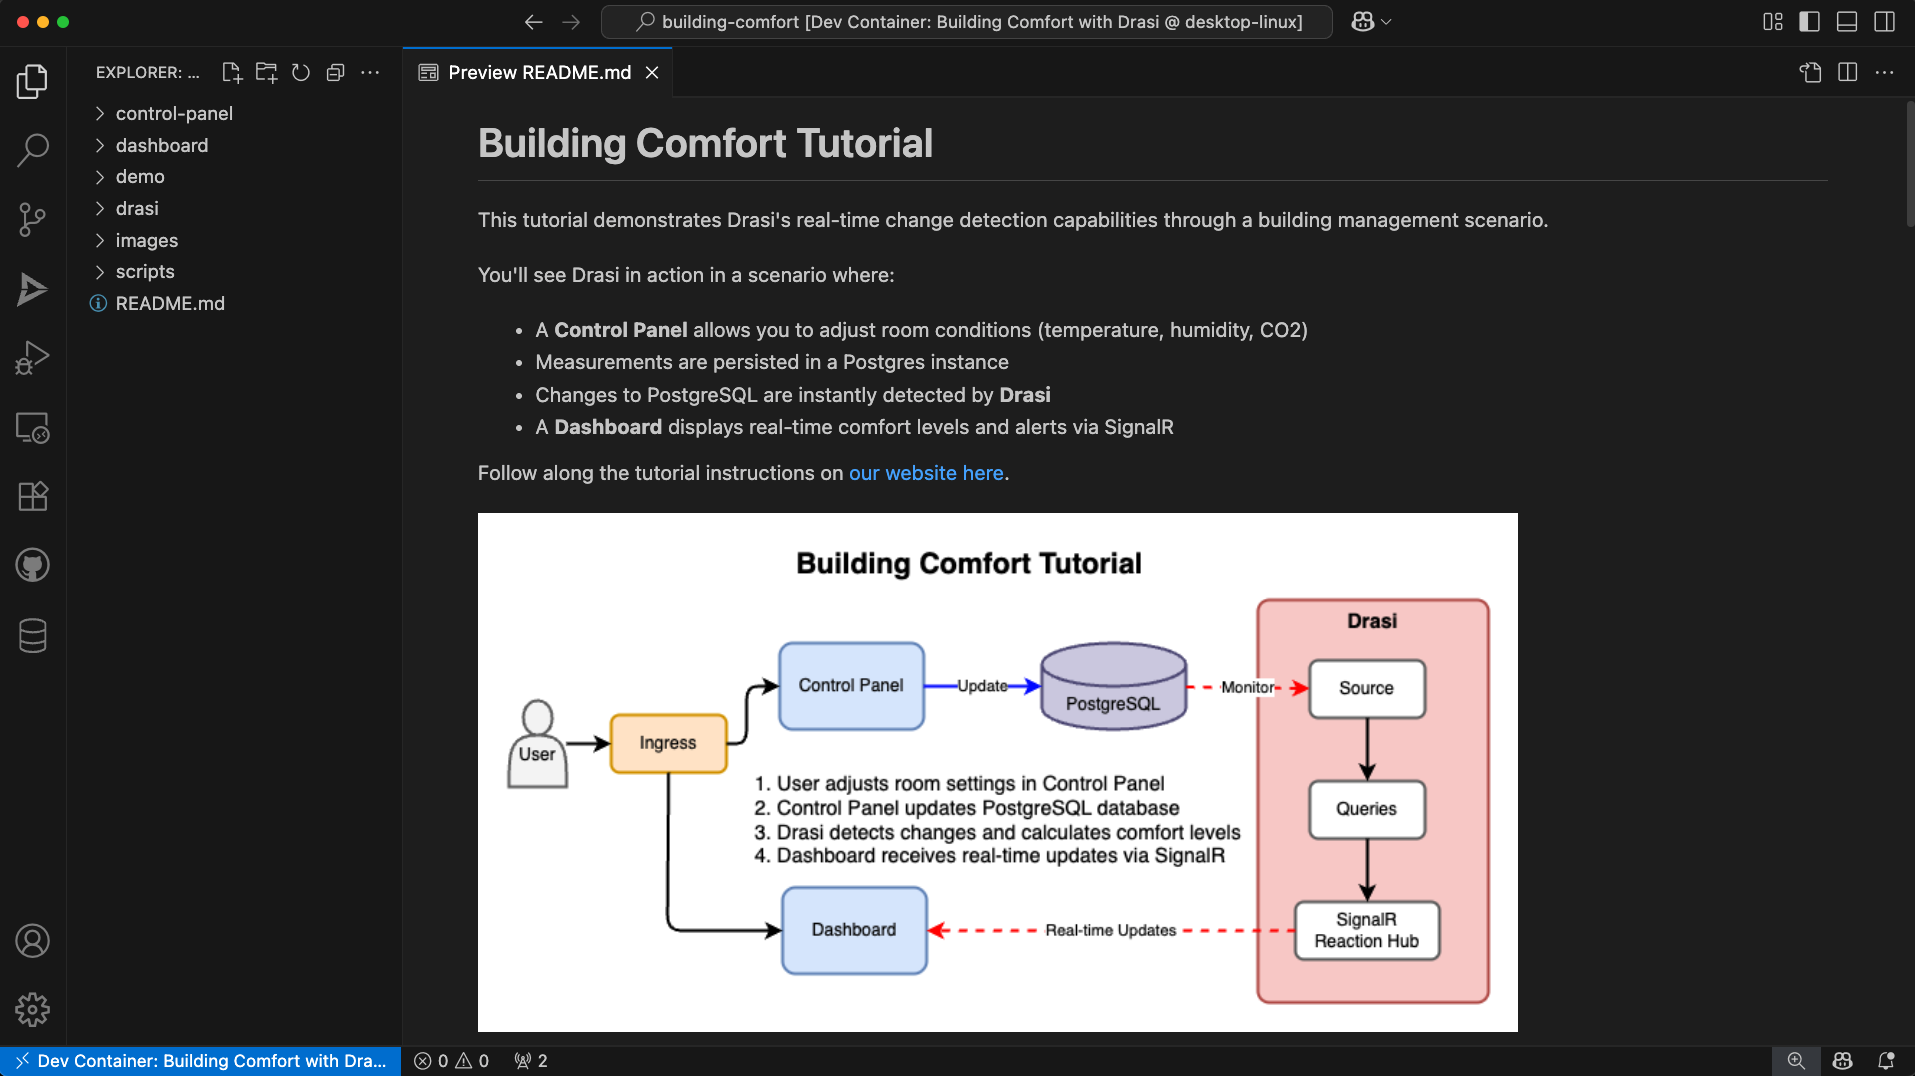
Once the setup is complete successfully, you should see a welcome message on the terminal, and the Readme file open:
To follow along with a Dev Container, you will need to install:
- Visual Studio Code
- Visual Studio Code Dev Containers extension
- docker
Next, clone the learning repo from Github, and open the repo in VS Code. Make sure that Docker daemon (or Docker Desktop) is running.
Once the solution is open in VS Code, follow these steps:
-
Press Cmd + Shift + P (on MacOS) or Ctrl + Shift + P (Windows or Linux) to launch the command palette.
-
Select
Dev Containers: Rebuild and Reopen in Container.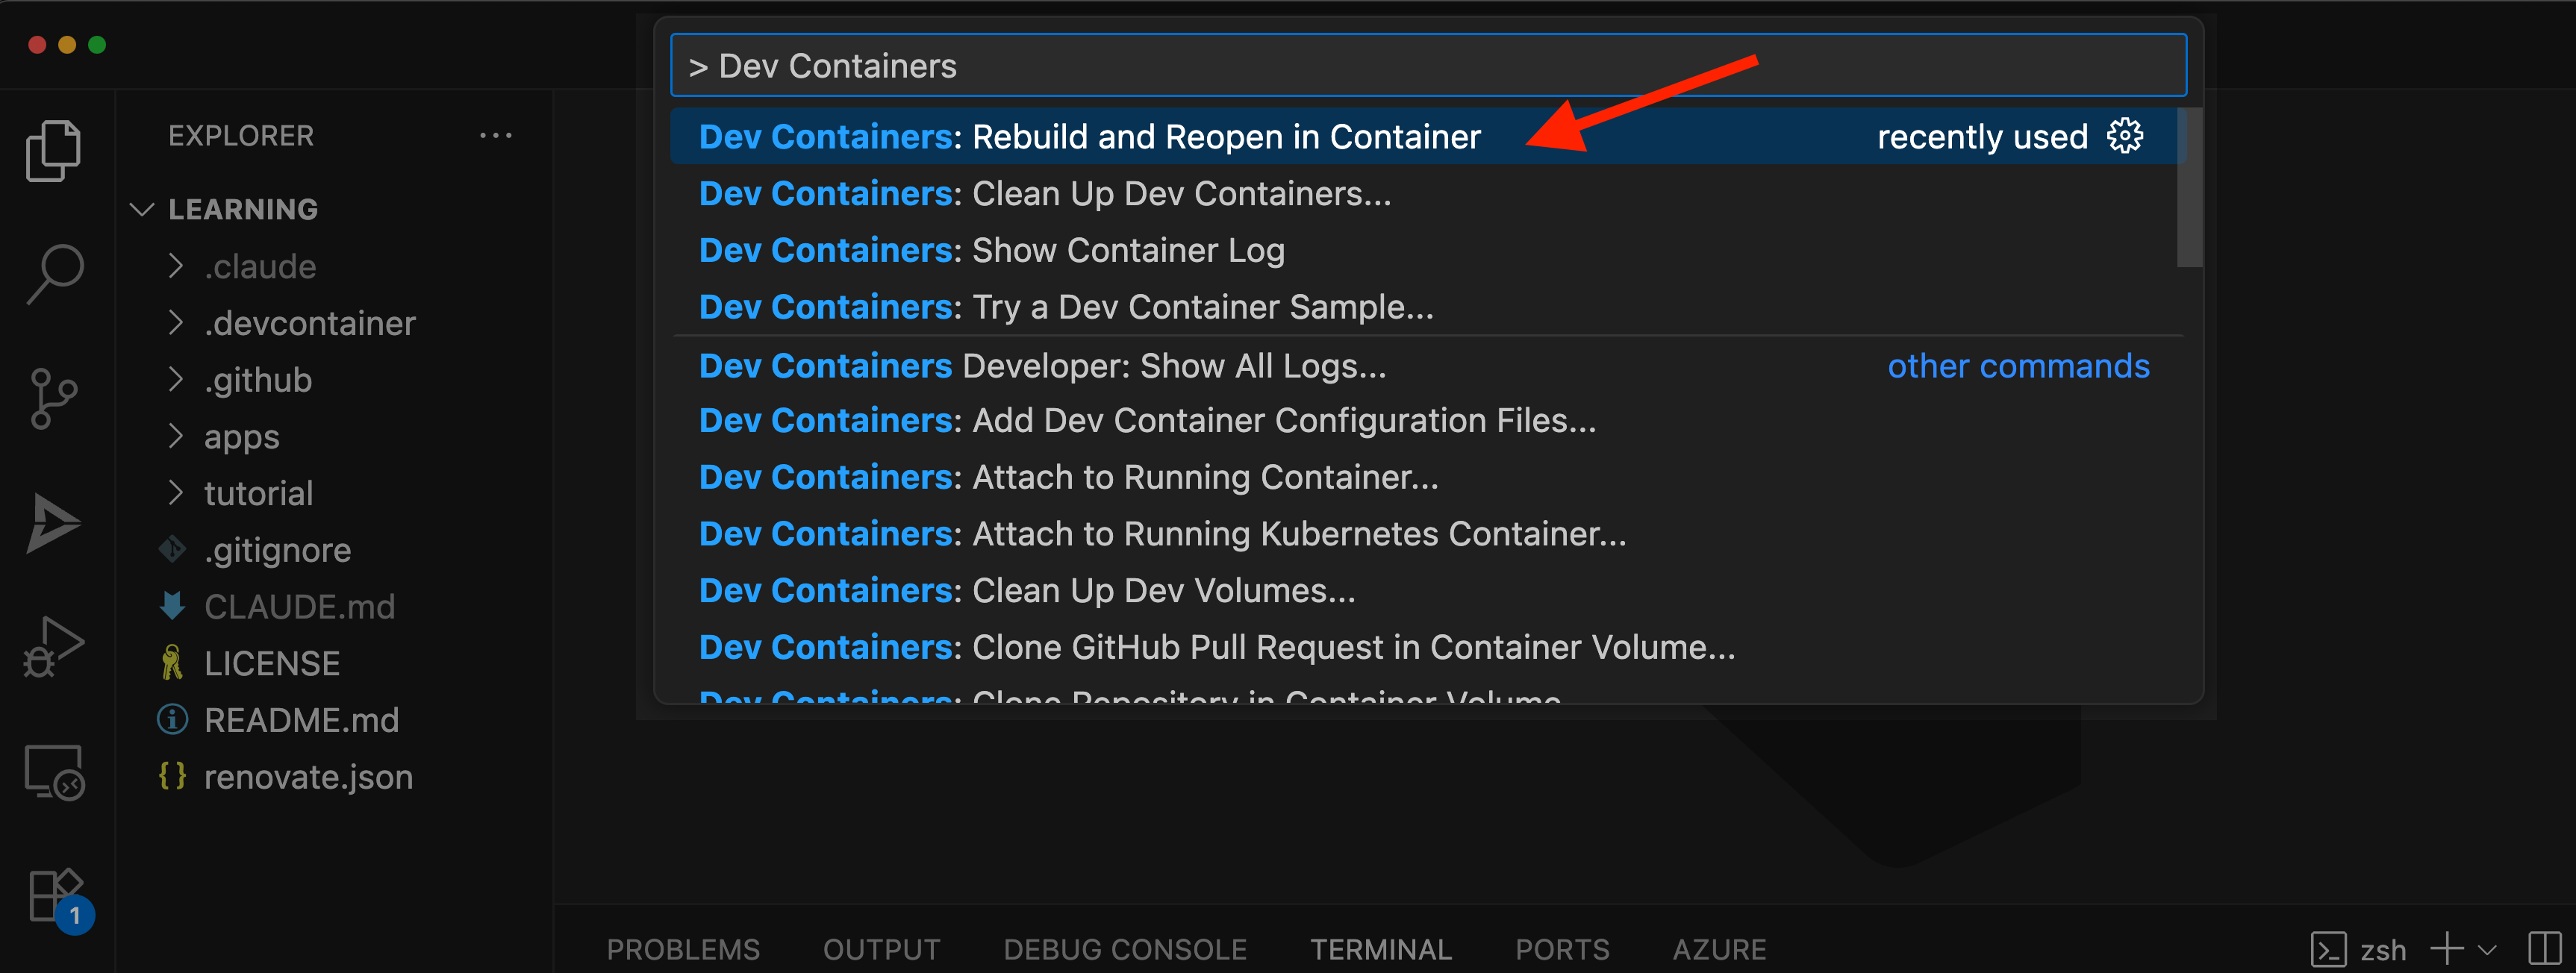
-
Select the
Building Comfort with Drasioption to launch this tutorial.
This will create a container and set it up for you. This might take up to 5 minutes and once ready, it will look something like this:
To run this tutorial locally, you’ll need:
For optimal performance with the Drasi Dev Container, we recommend configuring Docker with the following minimum resources:
- CPU: 3 cores or more
- Memory: 4 GB or more
- Swap: 1 GB or more
- Disk: 50 GB available space
To adjust these settings in Docker Desktop:
- Open Docker Desktop
- Go to Settings (gear icon)
- Navigate to “Resources” → “Advanced”
- Adjust the sliders to meet or exceed the recommended values
- Click “Apply & Restart”
Step 1: Clone the learning repo
Clone the learning repo from Github,
and navigate to the building comfort directory (learning/tutorial/building-comfort)
git clone https://github.com/drasi-project/learning
cd learning/tutorial/building-comfort
Step 2: Create k3d cluster
Use the commands below to create your own k3d cluster:
# Create k3d cluster with port mapping
k3d cluster create drasi-tutorial -p '8123:80@loadbalancer'

# Verify kubectl can connect (should show cluster info)
kubectl cluster-info
This creates a cluster with Traefik v2.x ingress controller included. The port mapping 8123:80 will allow you to access applications at http://localhost:8123.
Step 3: Deploy apps, Setup Ingress & Initialize Drasi
To make things easy, we have provided a helper script. The script will:
- Check for required tools (kubectl, Drasi CLI)
- Deploy PostgreSQL database with sample data
- Deploy all containerized applications
- Initialize Drasi
- Configure ingress routes (required - setup will fail if Traefik v2.x is not available)
Once your k3d cluster is ready with kubectl pointing to it, run the interactive setup script for your platform:
For macOS/Linux:
# Ensure that you are in the tutorial directory
cd tutorial/building-comfort

./scripts/setup-tutorial.sh
For Windows (PowerShell):
# Ensure that you are in the tutorial directory
cd tutorial\building-comfort

.\scripts\setup-tutorial.ps1
If the scripts don’t work for you, you can try to setup the environment yourself. For this you must deploy the deployment YAMLs inside the following paths, to your kubernetes cluster:
- tutorial/building-comfort/control-panel/k8s/*.yaml
- tutorial/building-comfort/dashboard/k8s/*.yaml
- tutorial/building-comfort/demo/k8s/*.yaml
After this you must initialize drasi:
drasi env kube
drasi init
Understanding the environment
Once your environment is ready, all applications sit behind an ingress, and are accessible through a single entry point.
The following applications are containerized and deployed on Kubernetes:
-
Control Panel (
/control-panel)- Used to simulate changes in sensor readings
- FastAPI backend with CRUD access to room sensor data
- Simple React frontend built with Vite
- Pre-loaded with sample buildings and rooms
-
Dashboard (
/dashboard)- React app built with Vite
- Connects to Drasi SignalR reaction
- Displays real-time comfort levels and alerts
-
Demo Portal (
/)- Simple HTML page with iframes
- Shows both applications in a single view
-
PostgreSQL Database
- Contains Building, Floor, and Room tables
- Pre-loaded with sample data
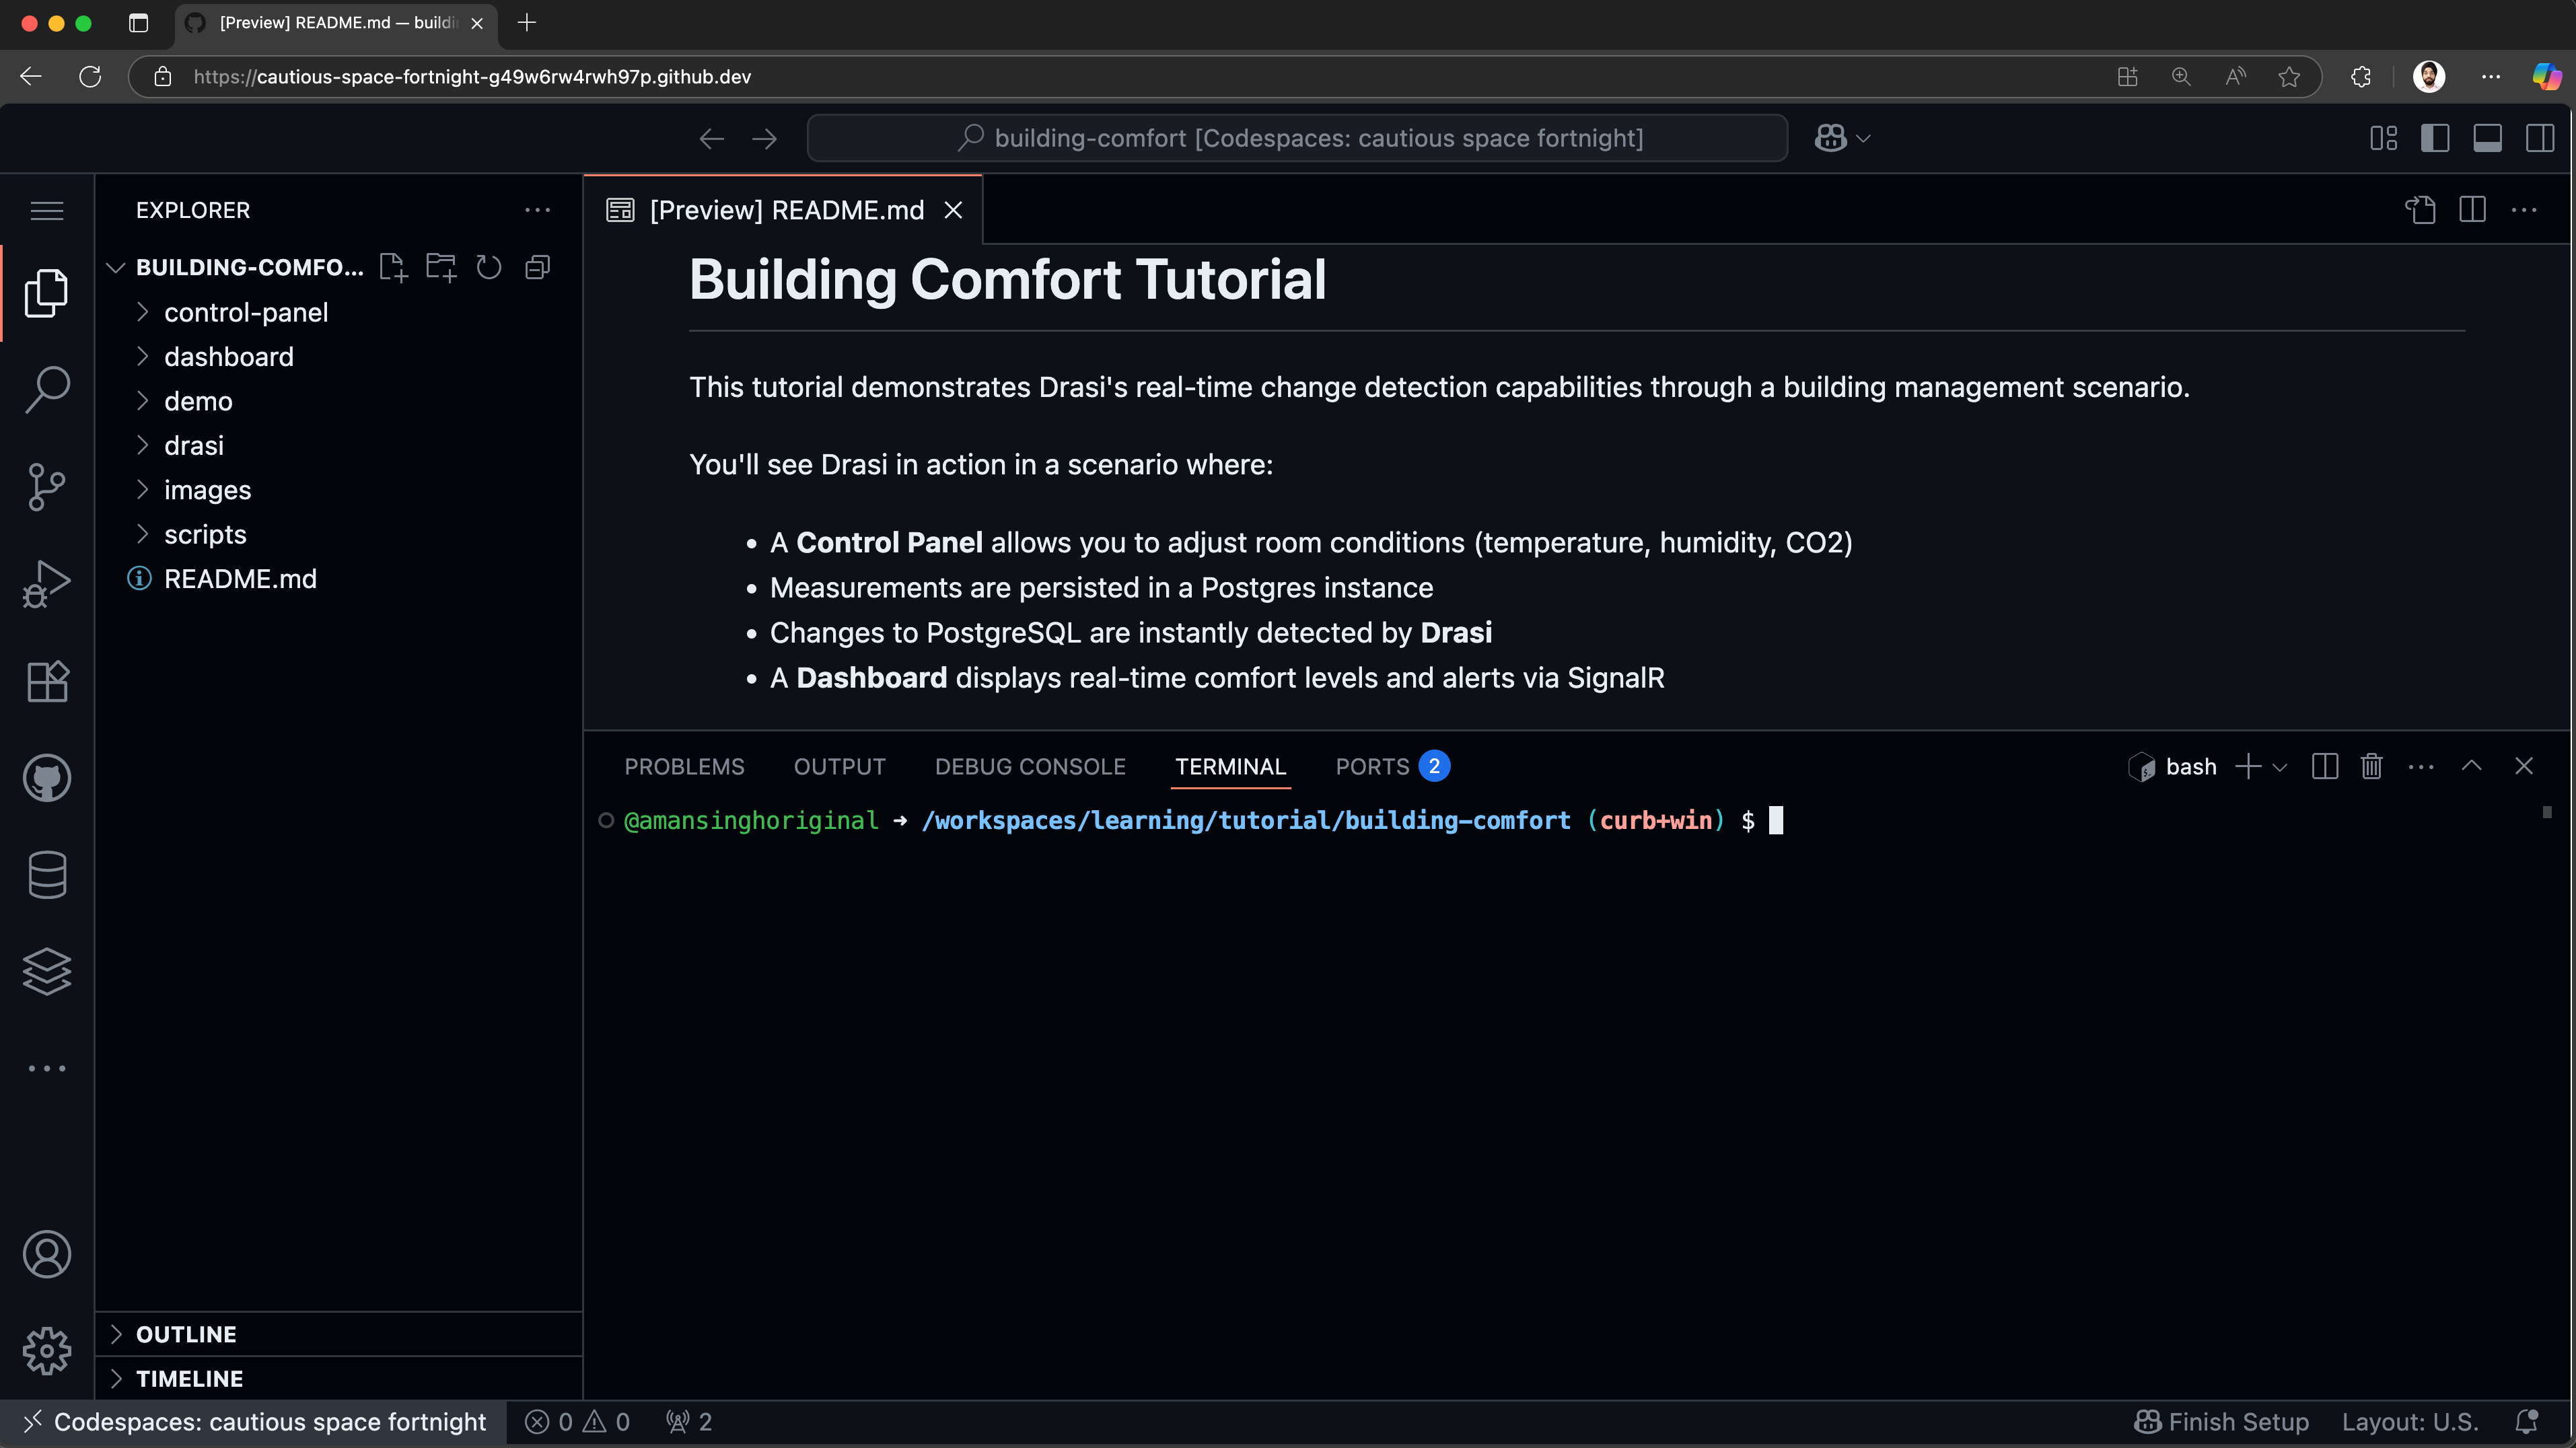
Once your codespace is ready, it should look something like this:
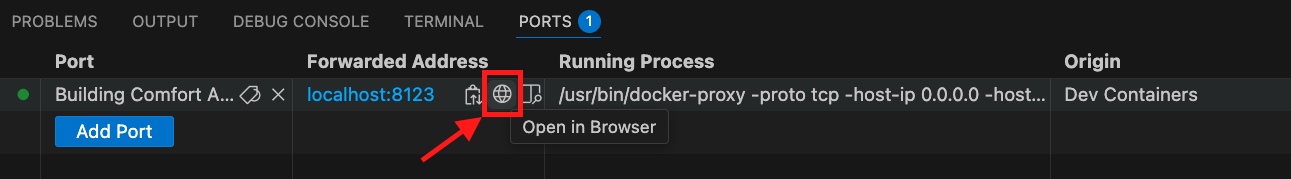
Open the Ports tab:
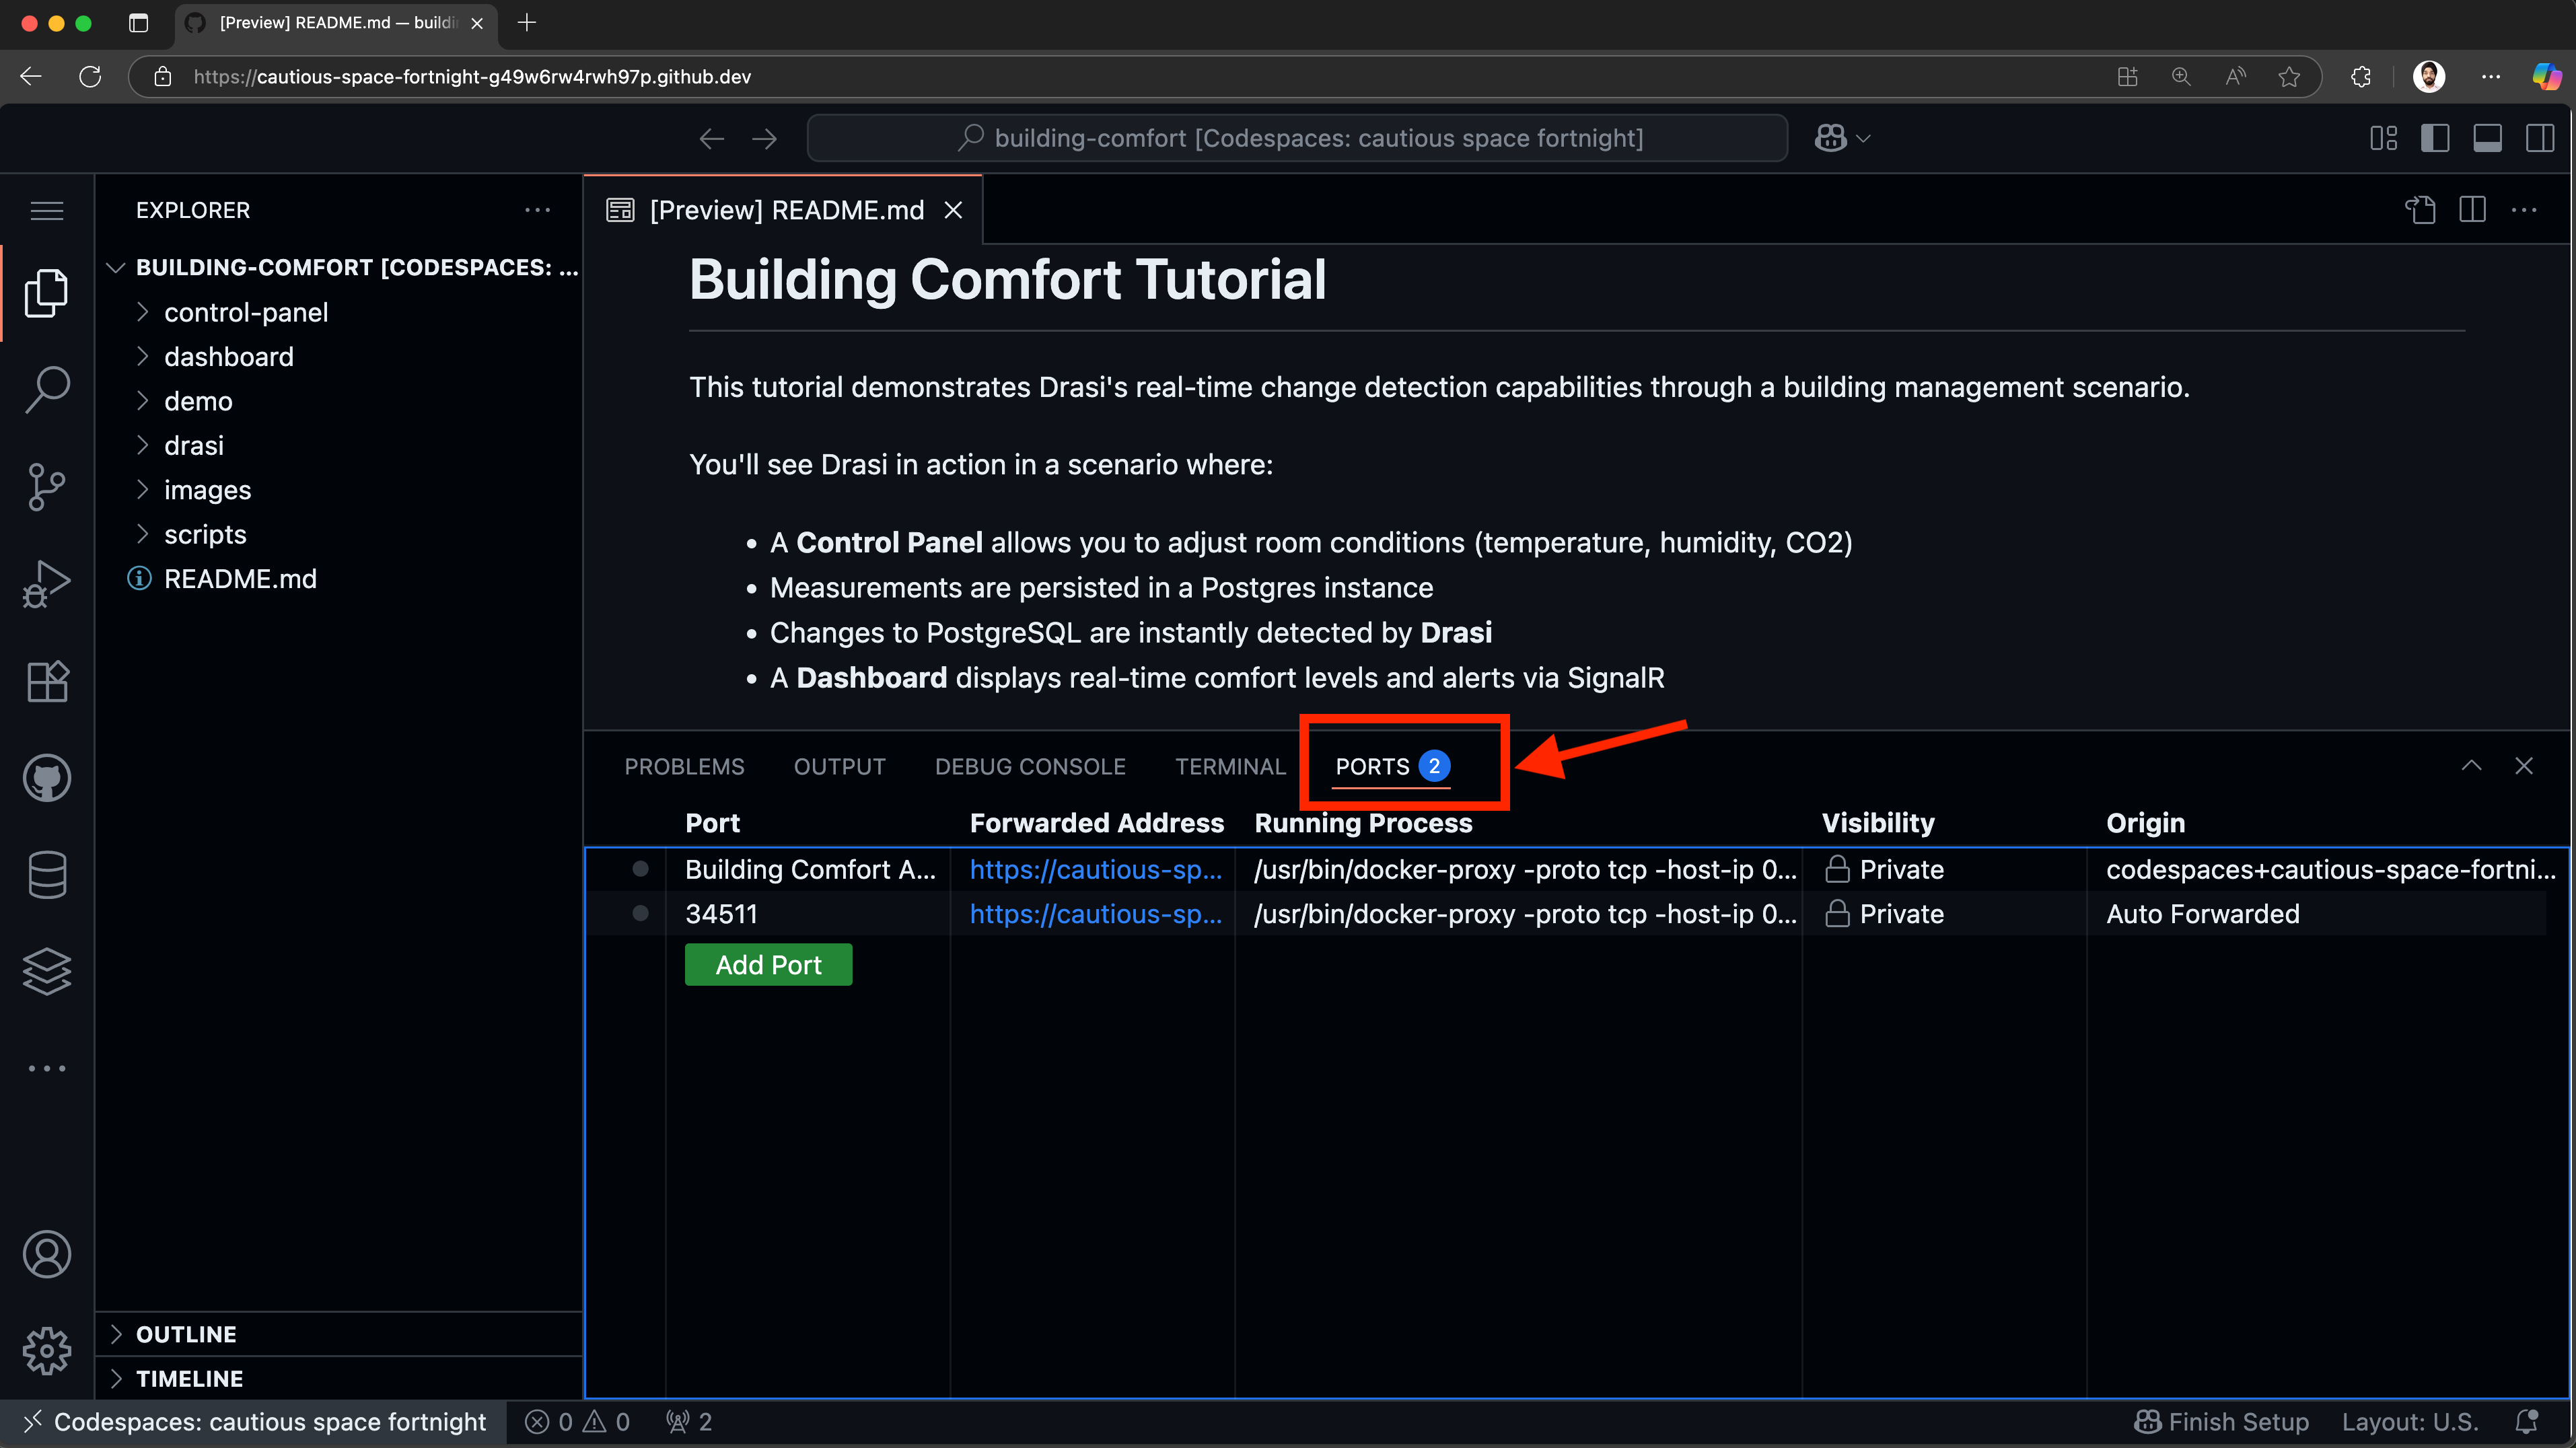
You should see a port already exported for “Building Comfort Apps”. Hover on the forwarded address and click on the button “Open in Browser”.
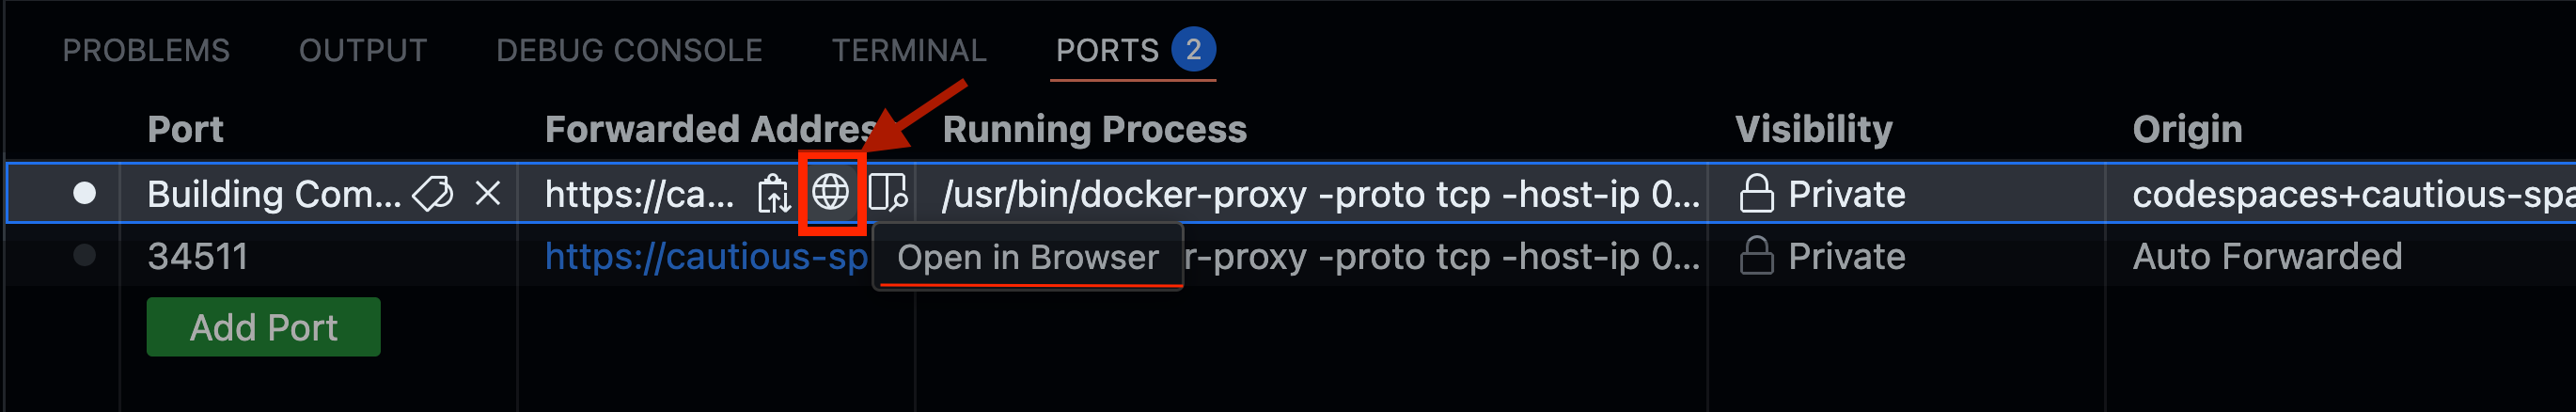
This will open up a URL (something like https://<your-codespace-id>-8123.app.github.dev/) in a new tab.
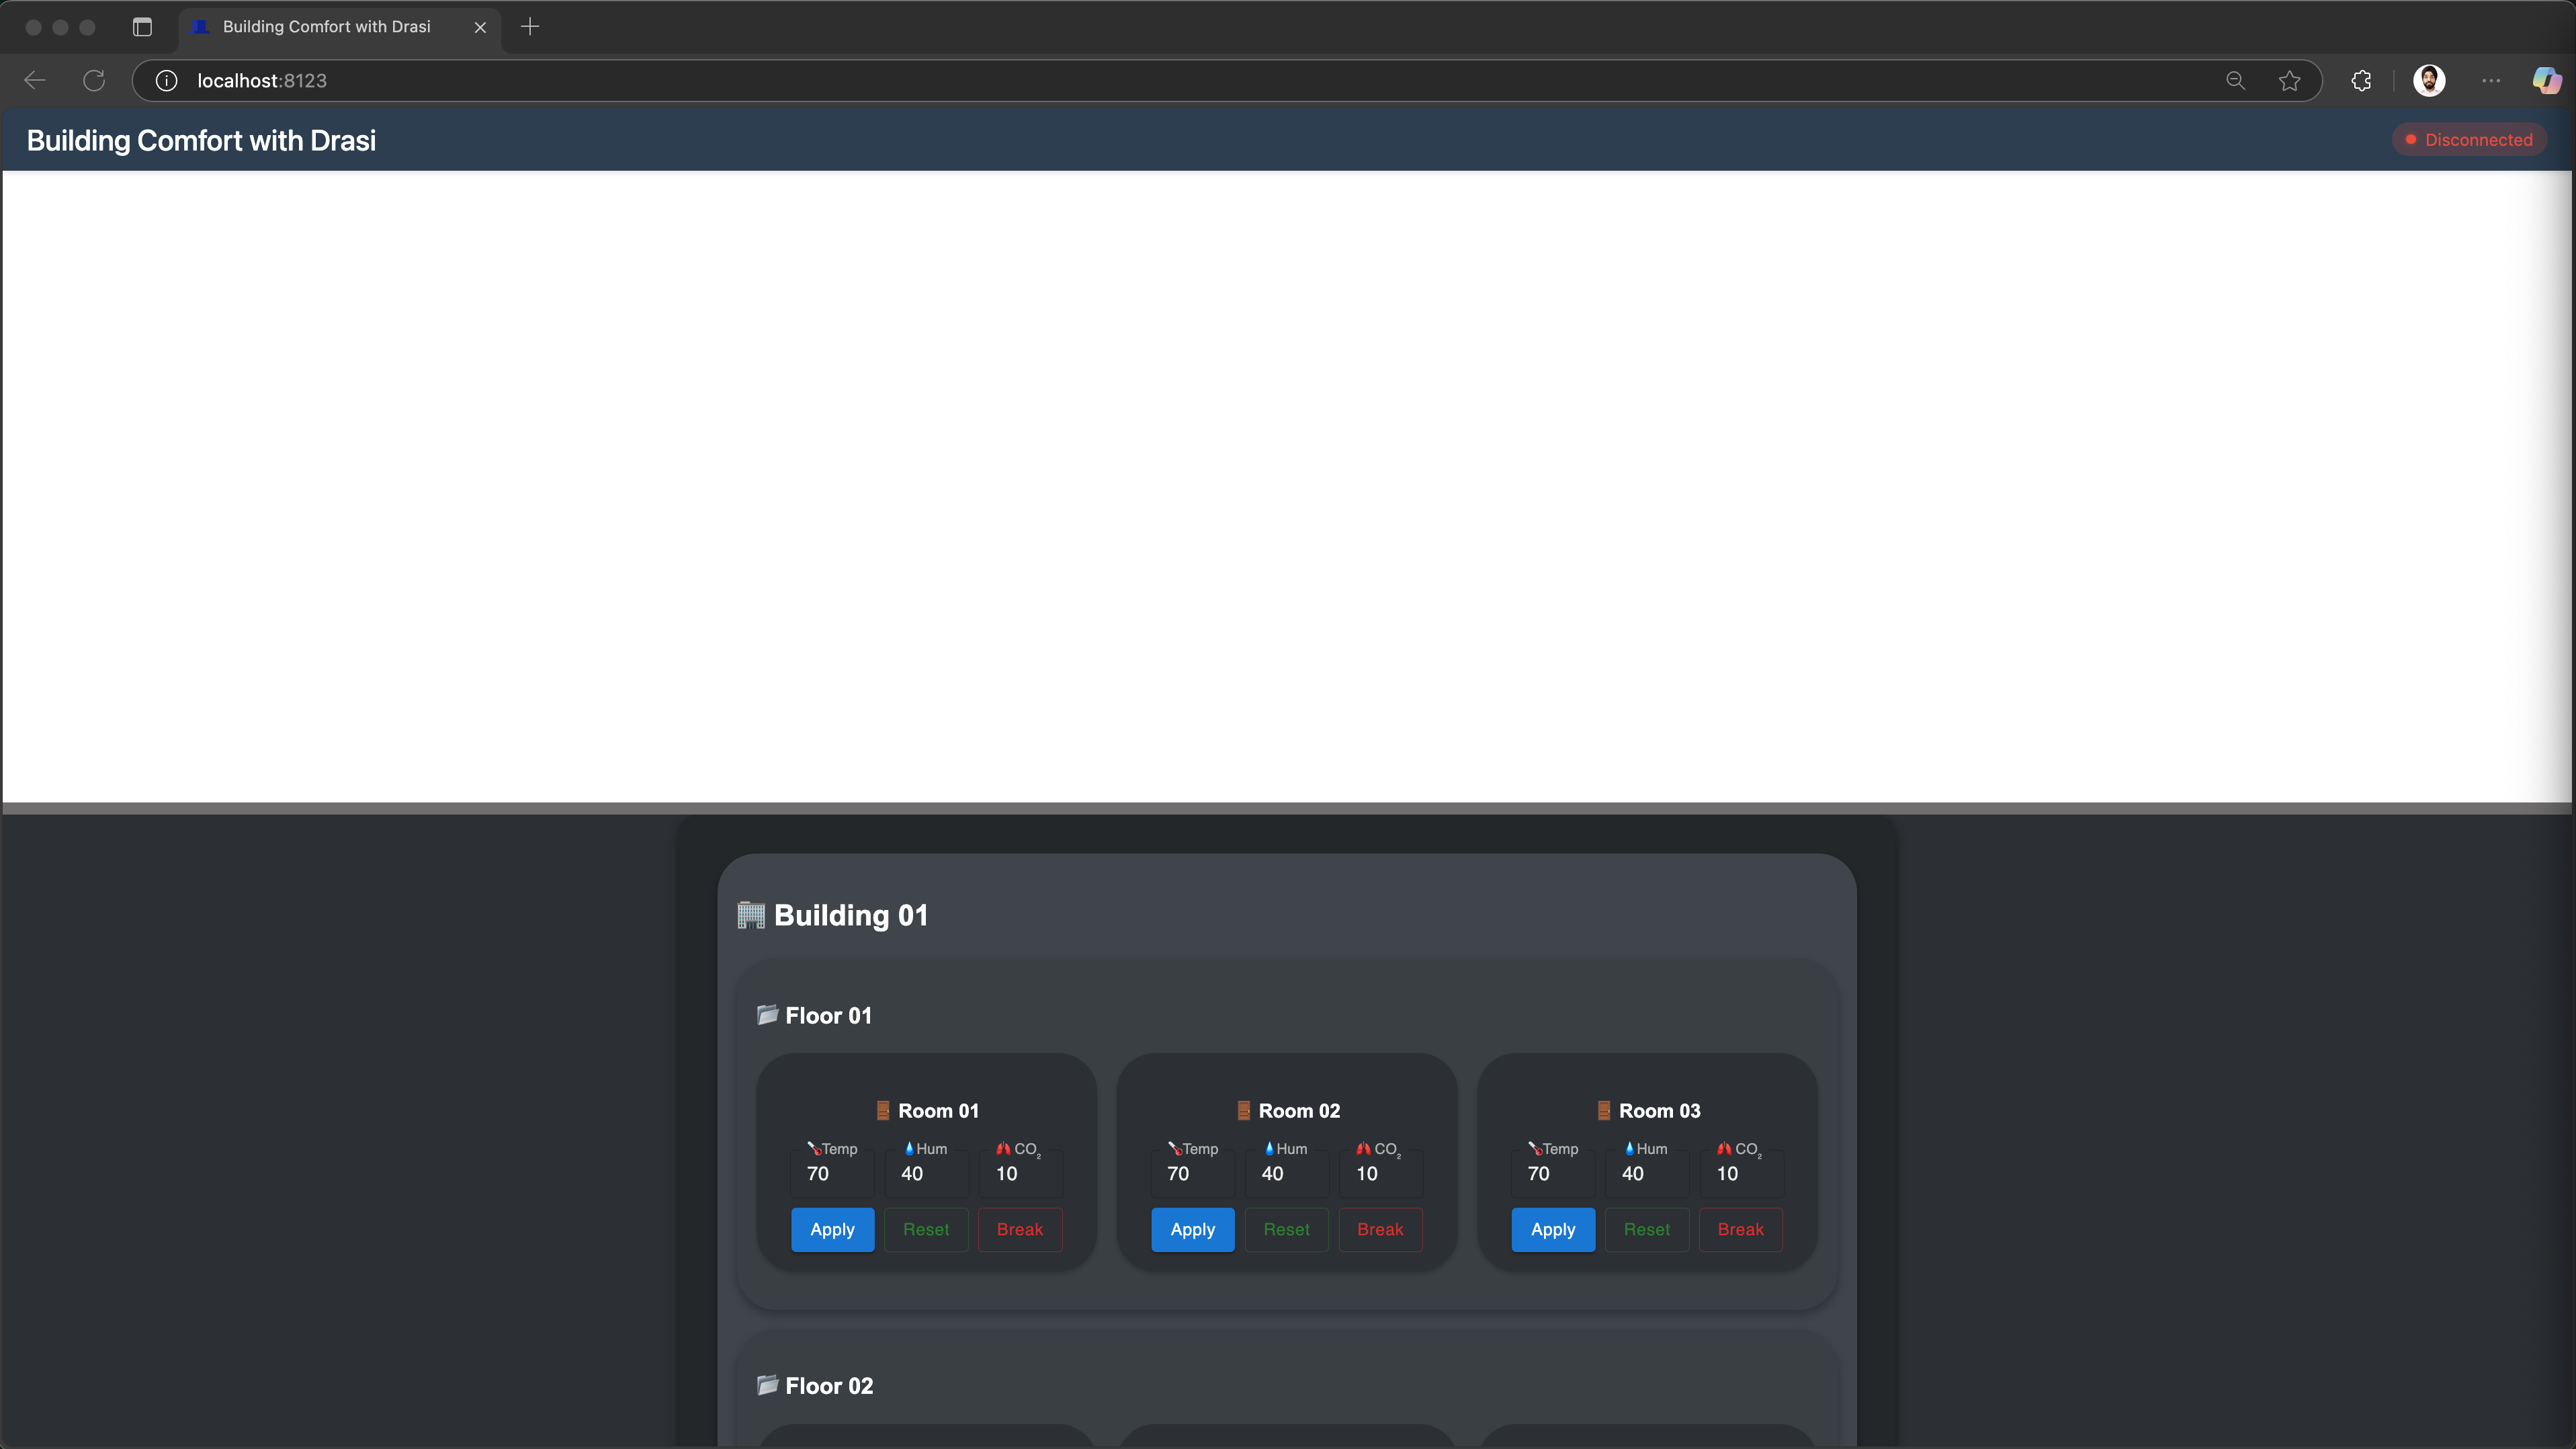
You should see a disconnected demo page like shown below.
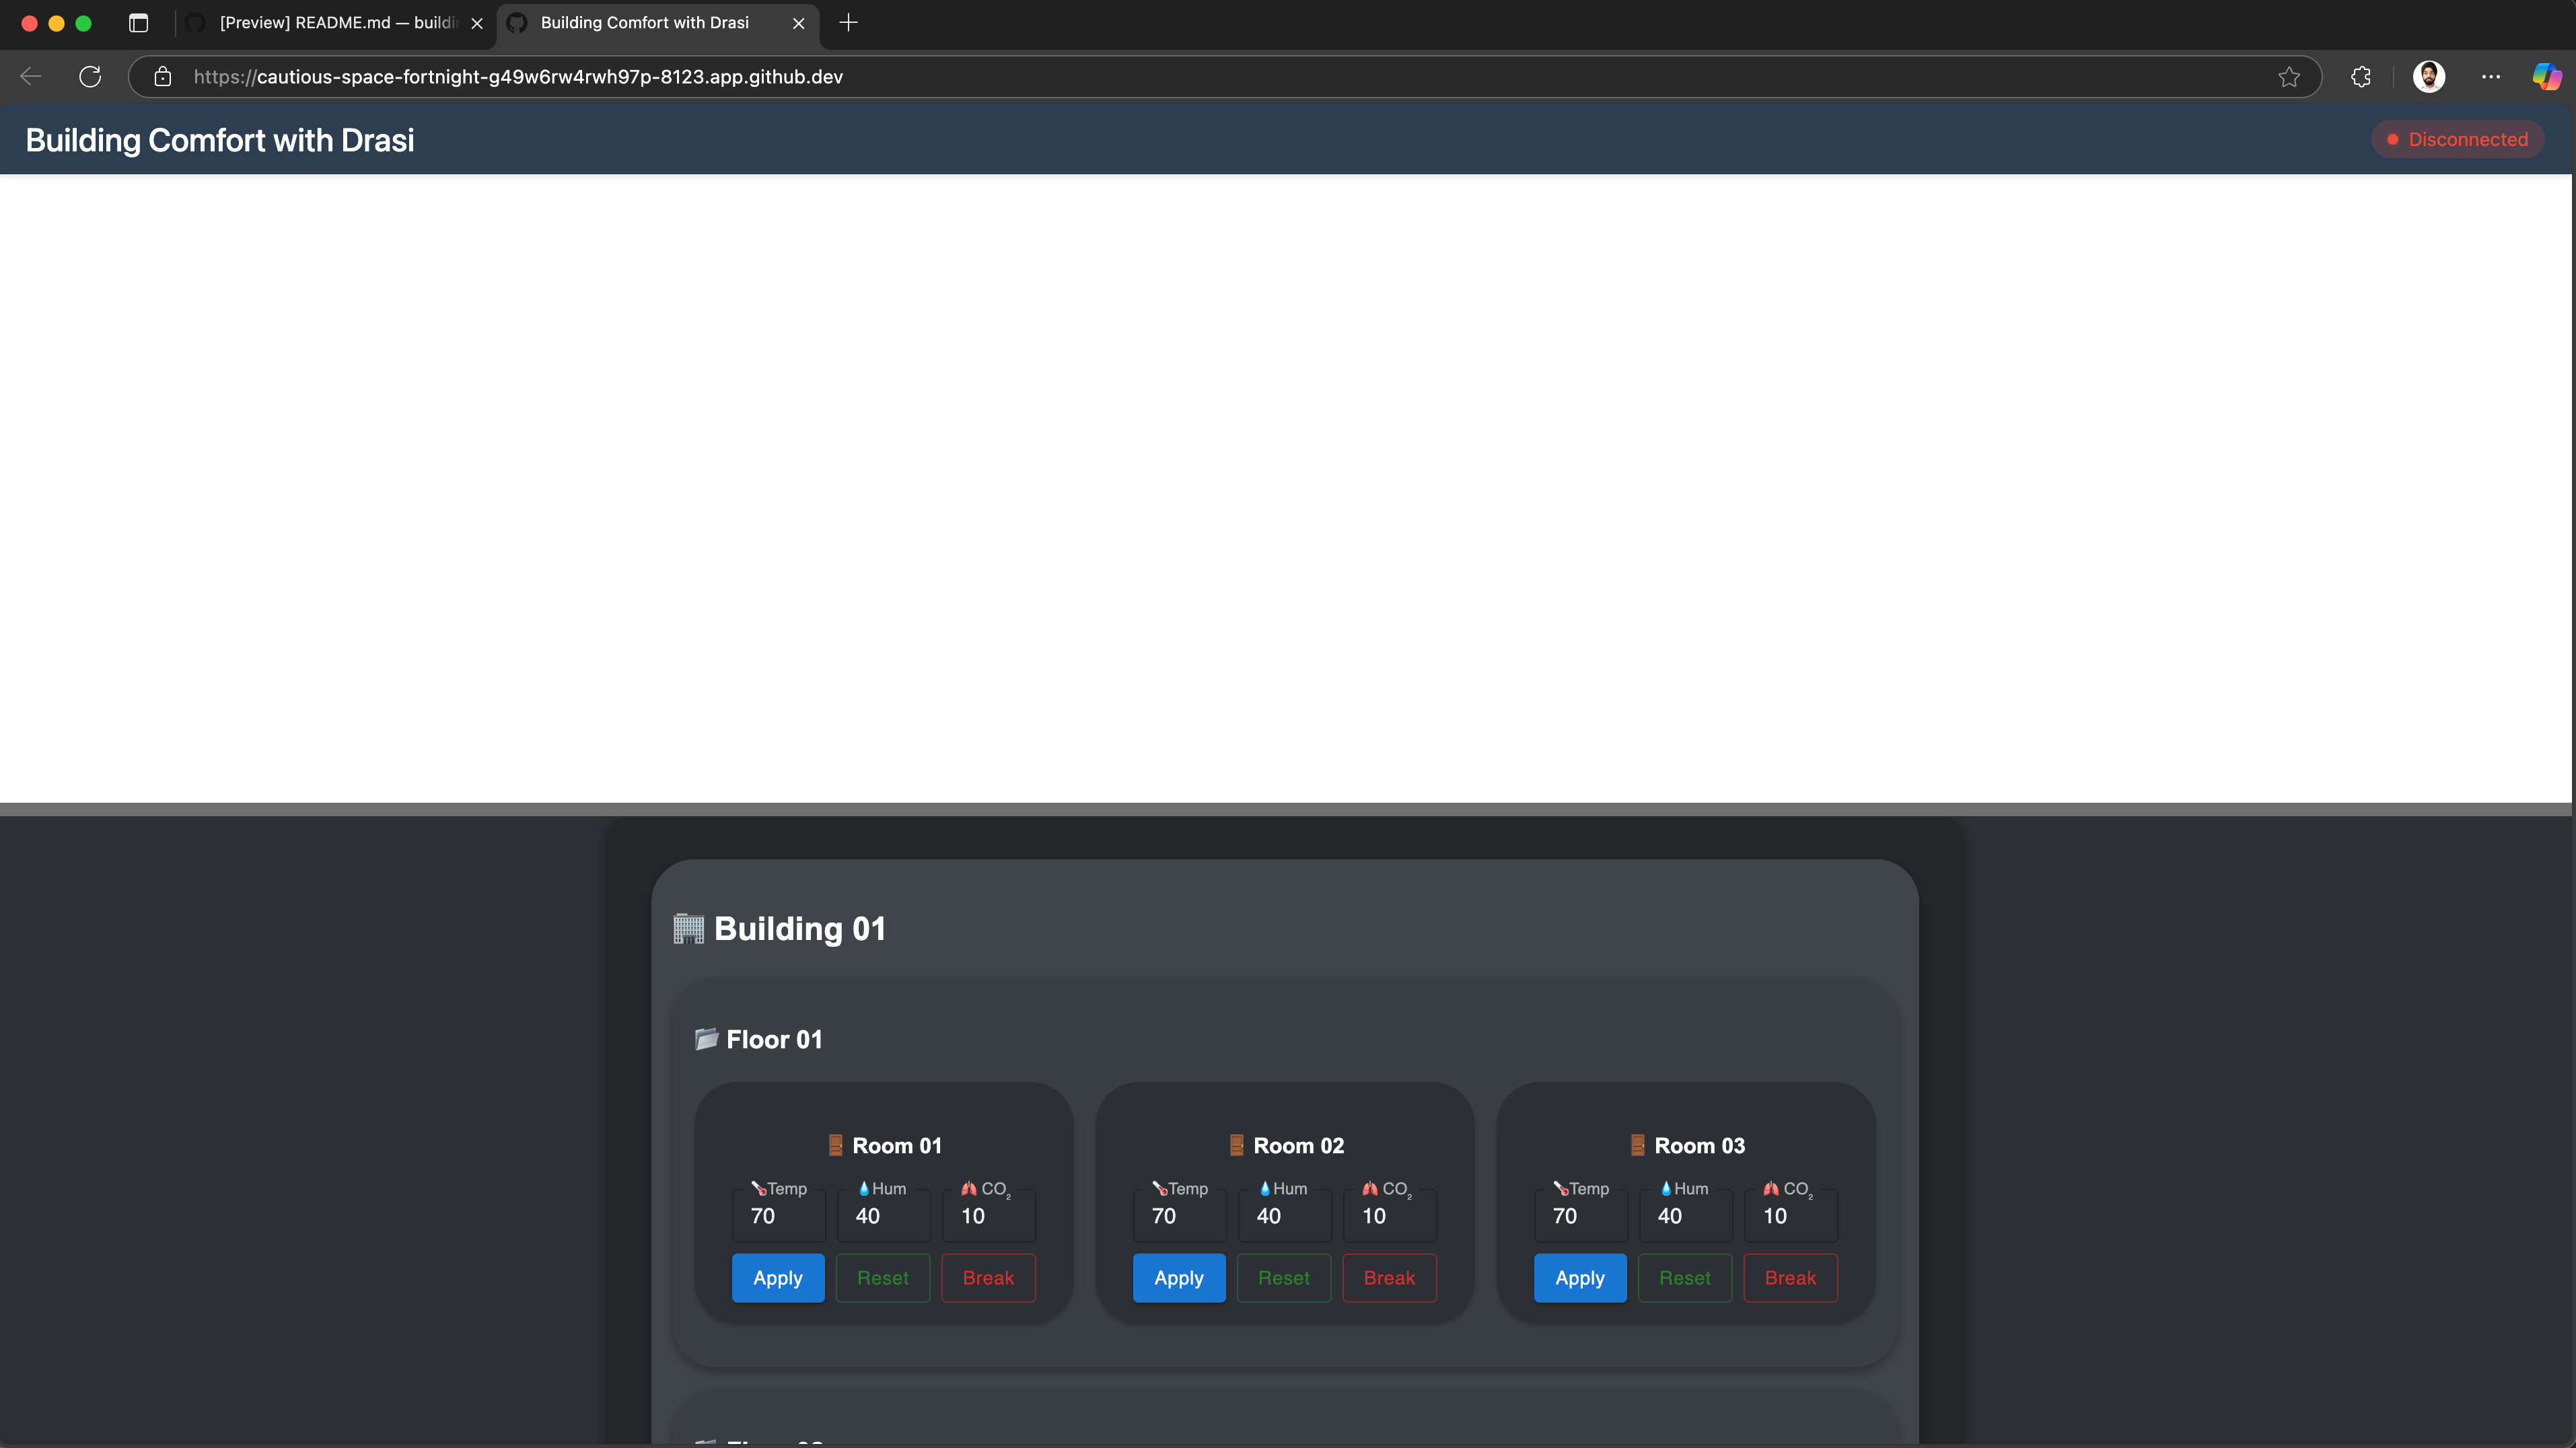
Note: This page shows Disconnected on the top right corner because the dashboard frontend has no websocket backend yet. We will use Drasi to deploy a SignalR server which will work as our websocket backend.
🚀 If you’re able to see this, your environment is setup correctly and you can proceed.
👍 The dashboard is still blank because our websocket server is not deployed
⌛️ If your dashboard is not loading, or your codespace wasn’t setup, please try recreating your codespace.
🤨 If you keep running into issues, please reach the Drasi team at our discord channel and share your codespace creation logs.
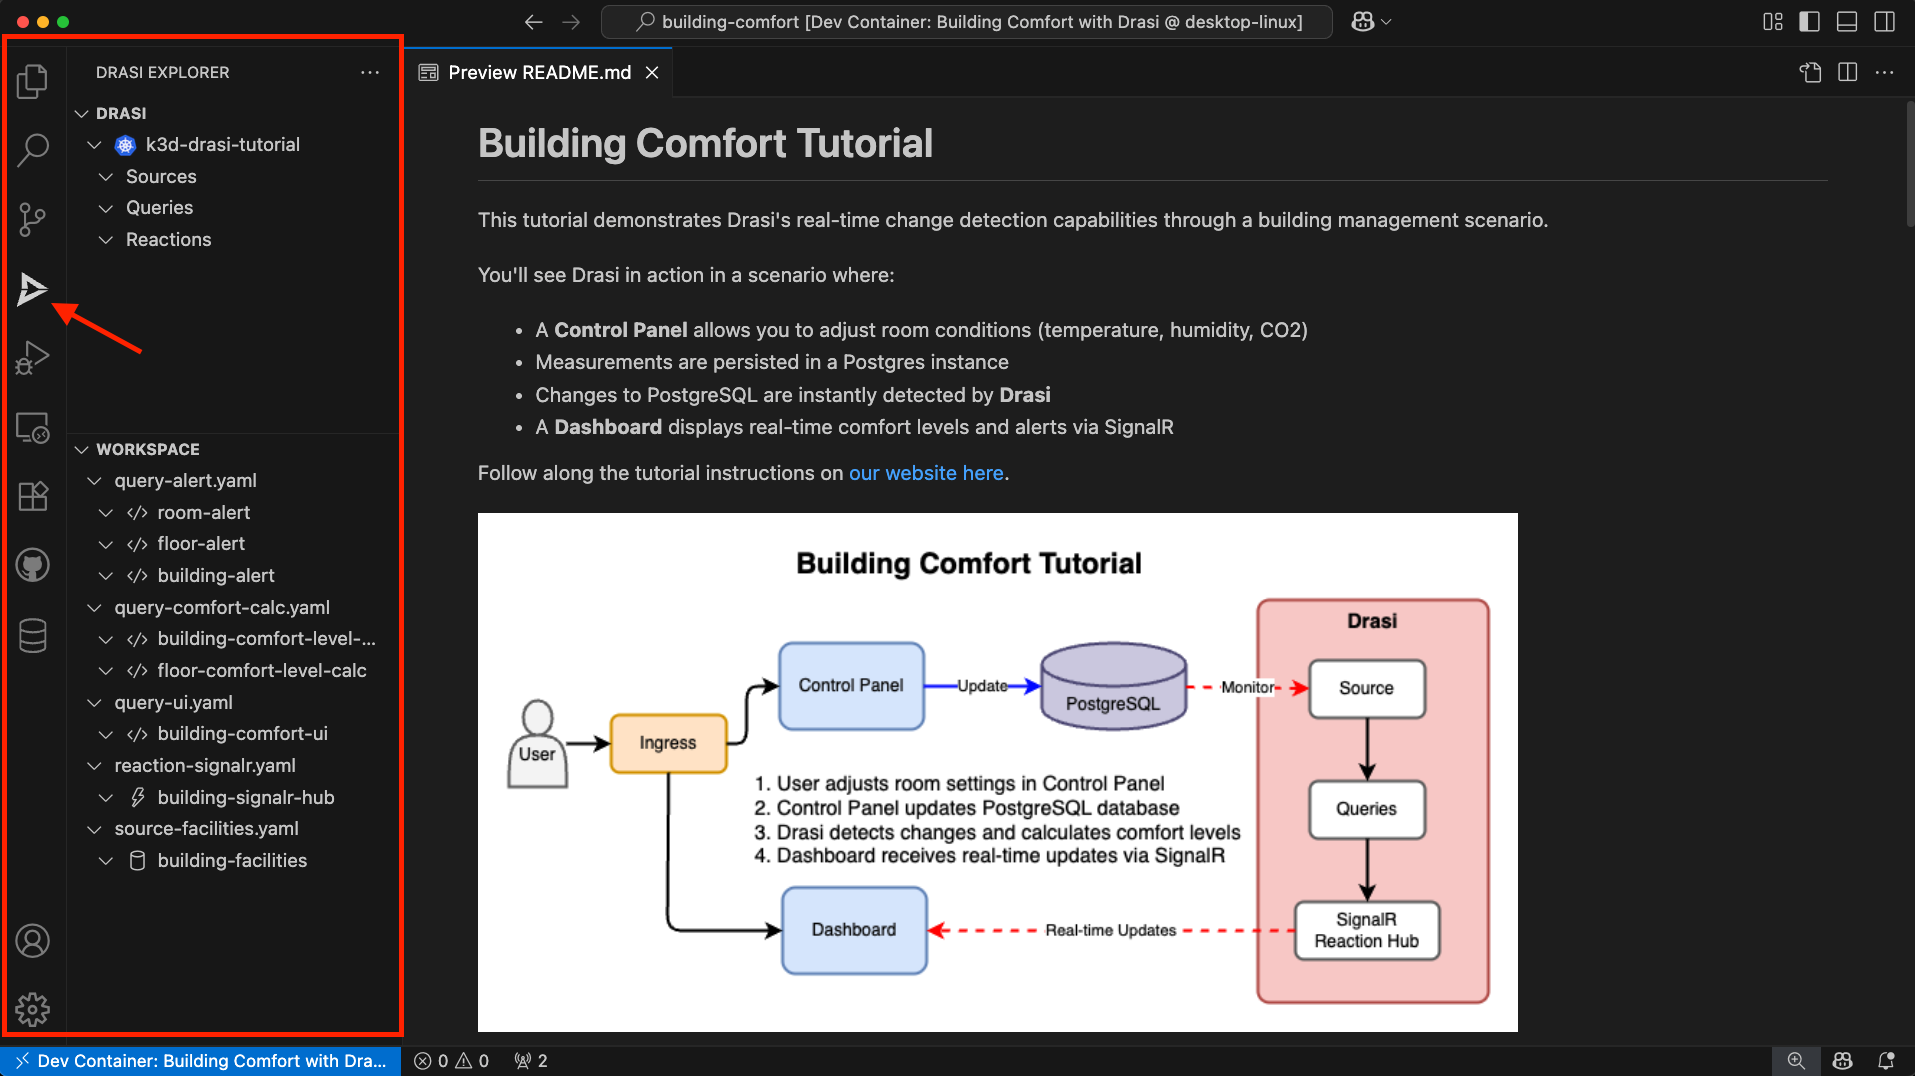
Once your devcontainer is ready, it should look something like this:
Open the Ports tab:
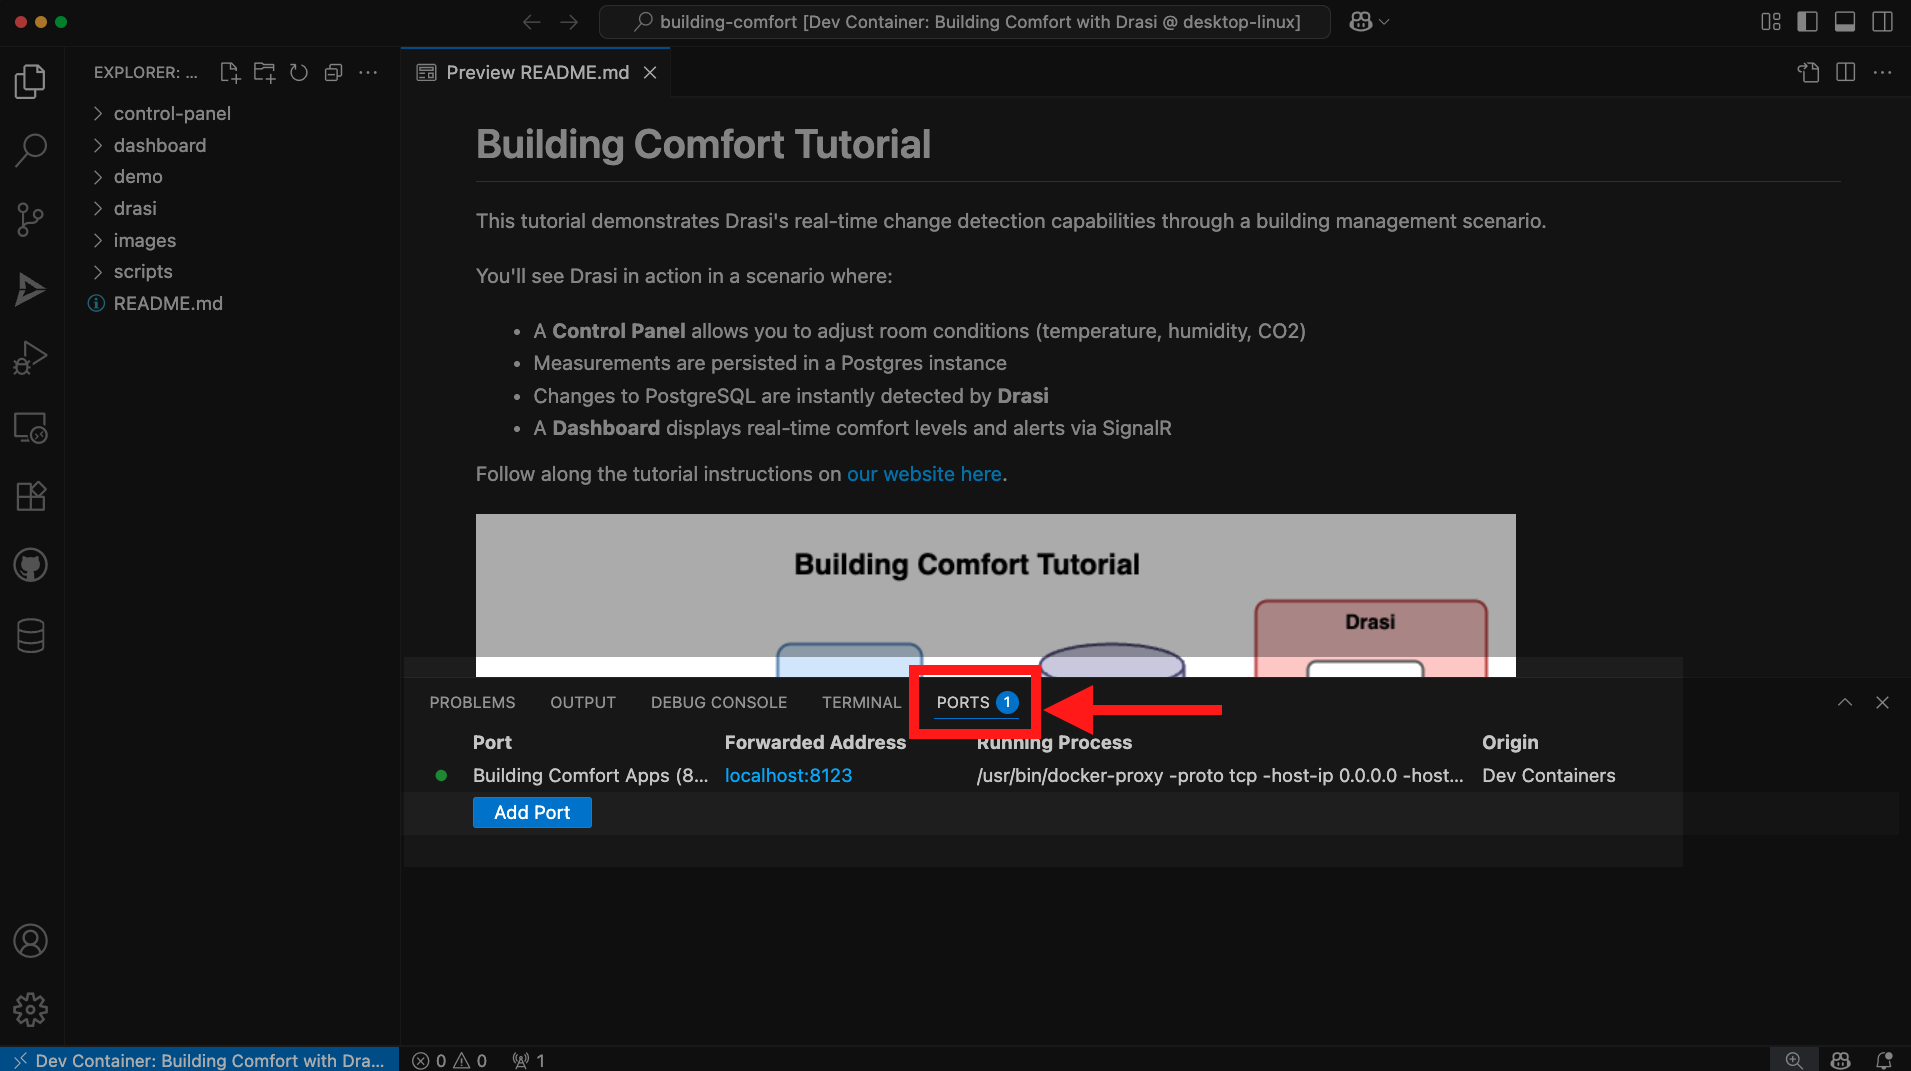
You should see a port already exported for “Building Comfort Apps”. Hover on the forwarded address and click on the button “Open in Browser”.
This will open up a URL (like http://localhost:8123) in a new tab.
You should see a disconnected demo page like shown below.
Note: This page shows Disconnected on the top right corner because the dashboard frontend has no websocket backend yet. We will use Drasi to deploy a SignalR server which will work as our websocket backend.
🚀 If you’re able to see this, your environment is setup correctly and you can proceed.
👍 The dashboard is still blank because our websocket server is not deployed
⌛️ If your dashboard is not loading, or your codespace wasn’t setup, please try recreating your dev container.
🤨 If you keep running into issues, please reach the Drasi team at our discord channel and share your dev-container creation logs.
Open http://localhost:8123/ in your browser to see the demo portal showing both the dashboard and control panel.
You should see a disconnected demo page like shown below.
Note: This page shows Disconnected on the top right corner because the dashboard frontend has no websocket backend yet. We will use Drasi to deploy a SignalR server which will work as our websocket backend.
🚀 If you’re able to see this, your environment is setup correctly and you can proceed.
👍 The dashboard is still blank because our websocket server is not deployed
🤨 If you keep running into issues, please reach the Drasi team at our discord channel.
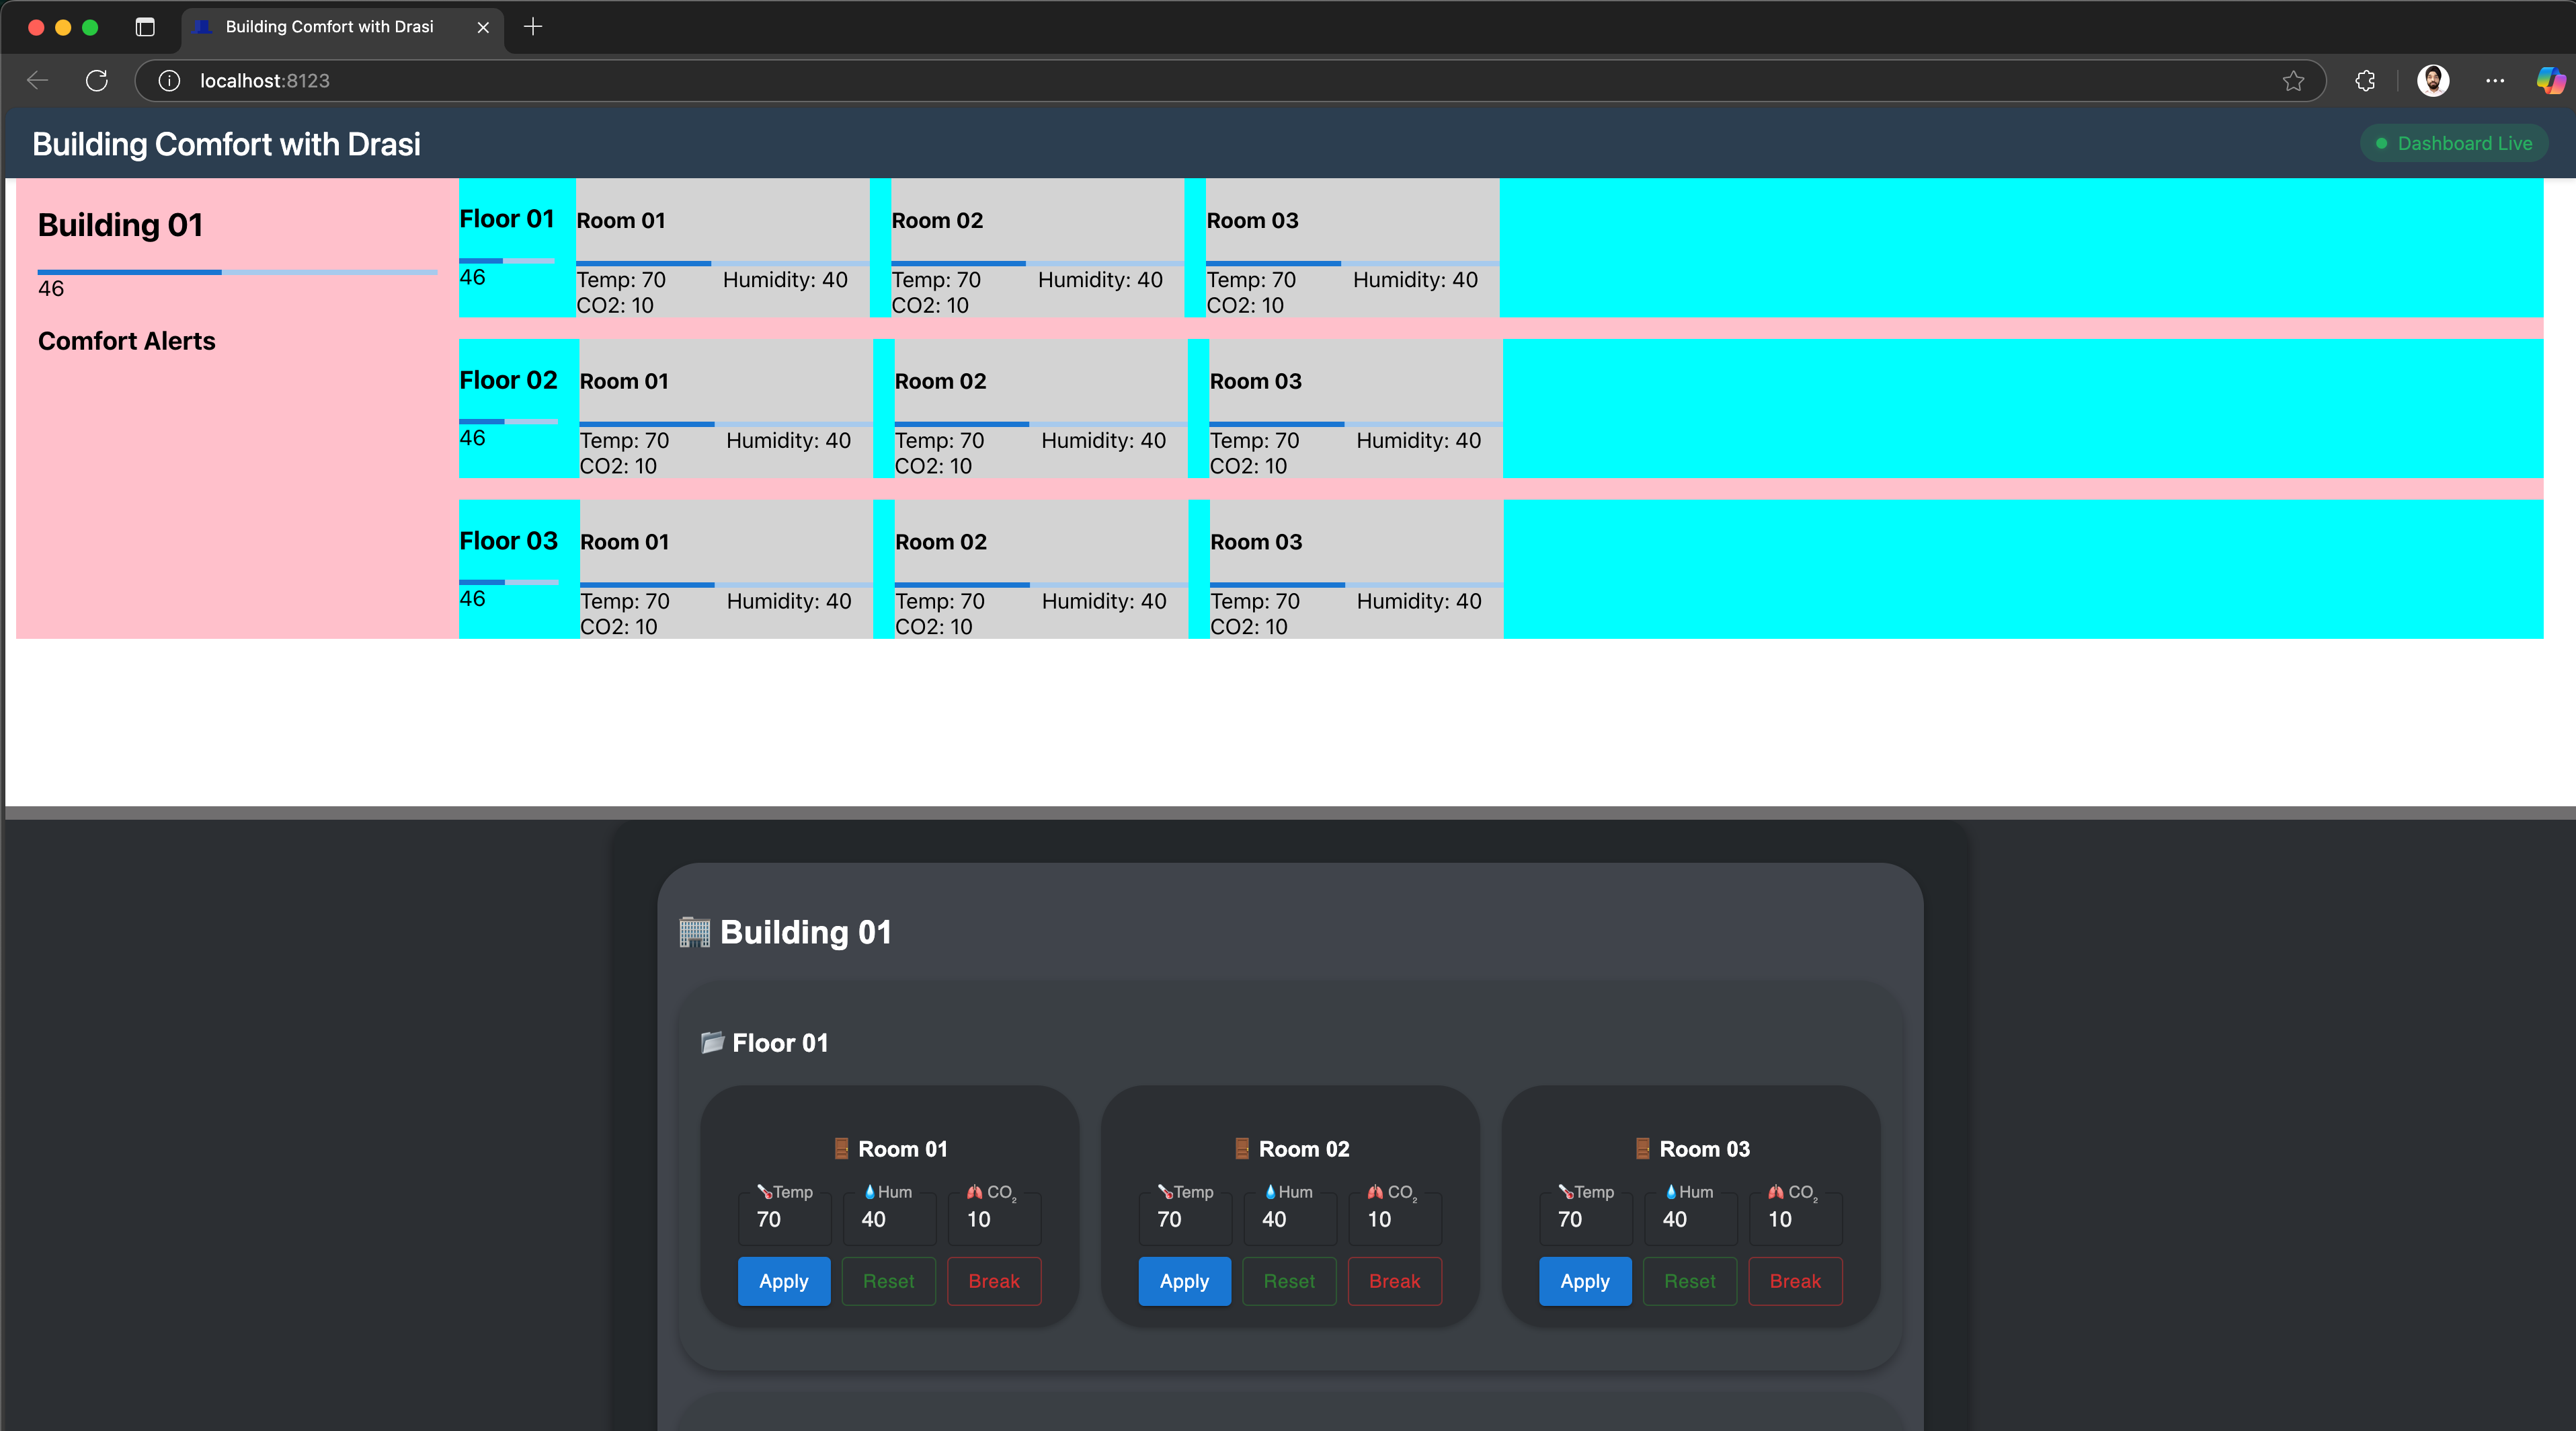
If your environment setup was complete, you should see the demo portal. This demo portal shows:
- Top half: Real-time dashboard displaying building comfort levels
- Bottom half: Control panel to adjust room conditions
The code to build the realtime dashboard lives in directory tutorial/building-comfort/dashboard and the dashboard can be accessed directly by adding /dashboard to the URL opened for your demo portal.
The control panel code is in directory tutorial/building-comfort/control-panel, and it can be accessed directly by adding /control-panel to the URL opened for your demo portal. The Swagger is accessible by adding /control-panel/docs.
Drasi VSCode Extension
We also have a VSCode extension for Drasi, which can make it easy to debug and deploy Drasi components. Although this is not required, you can use this during our tutorial if you want a terminal-free experience.
Your codespace already has the Drasi extension installed:
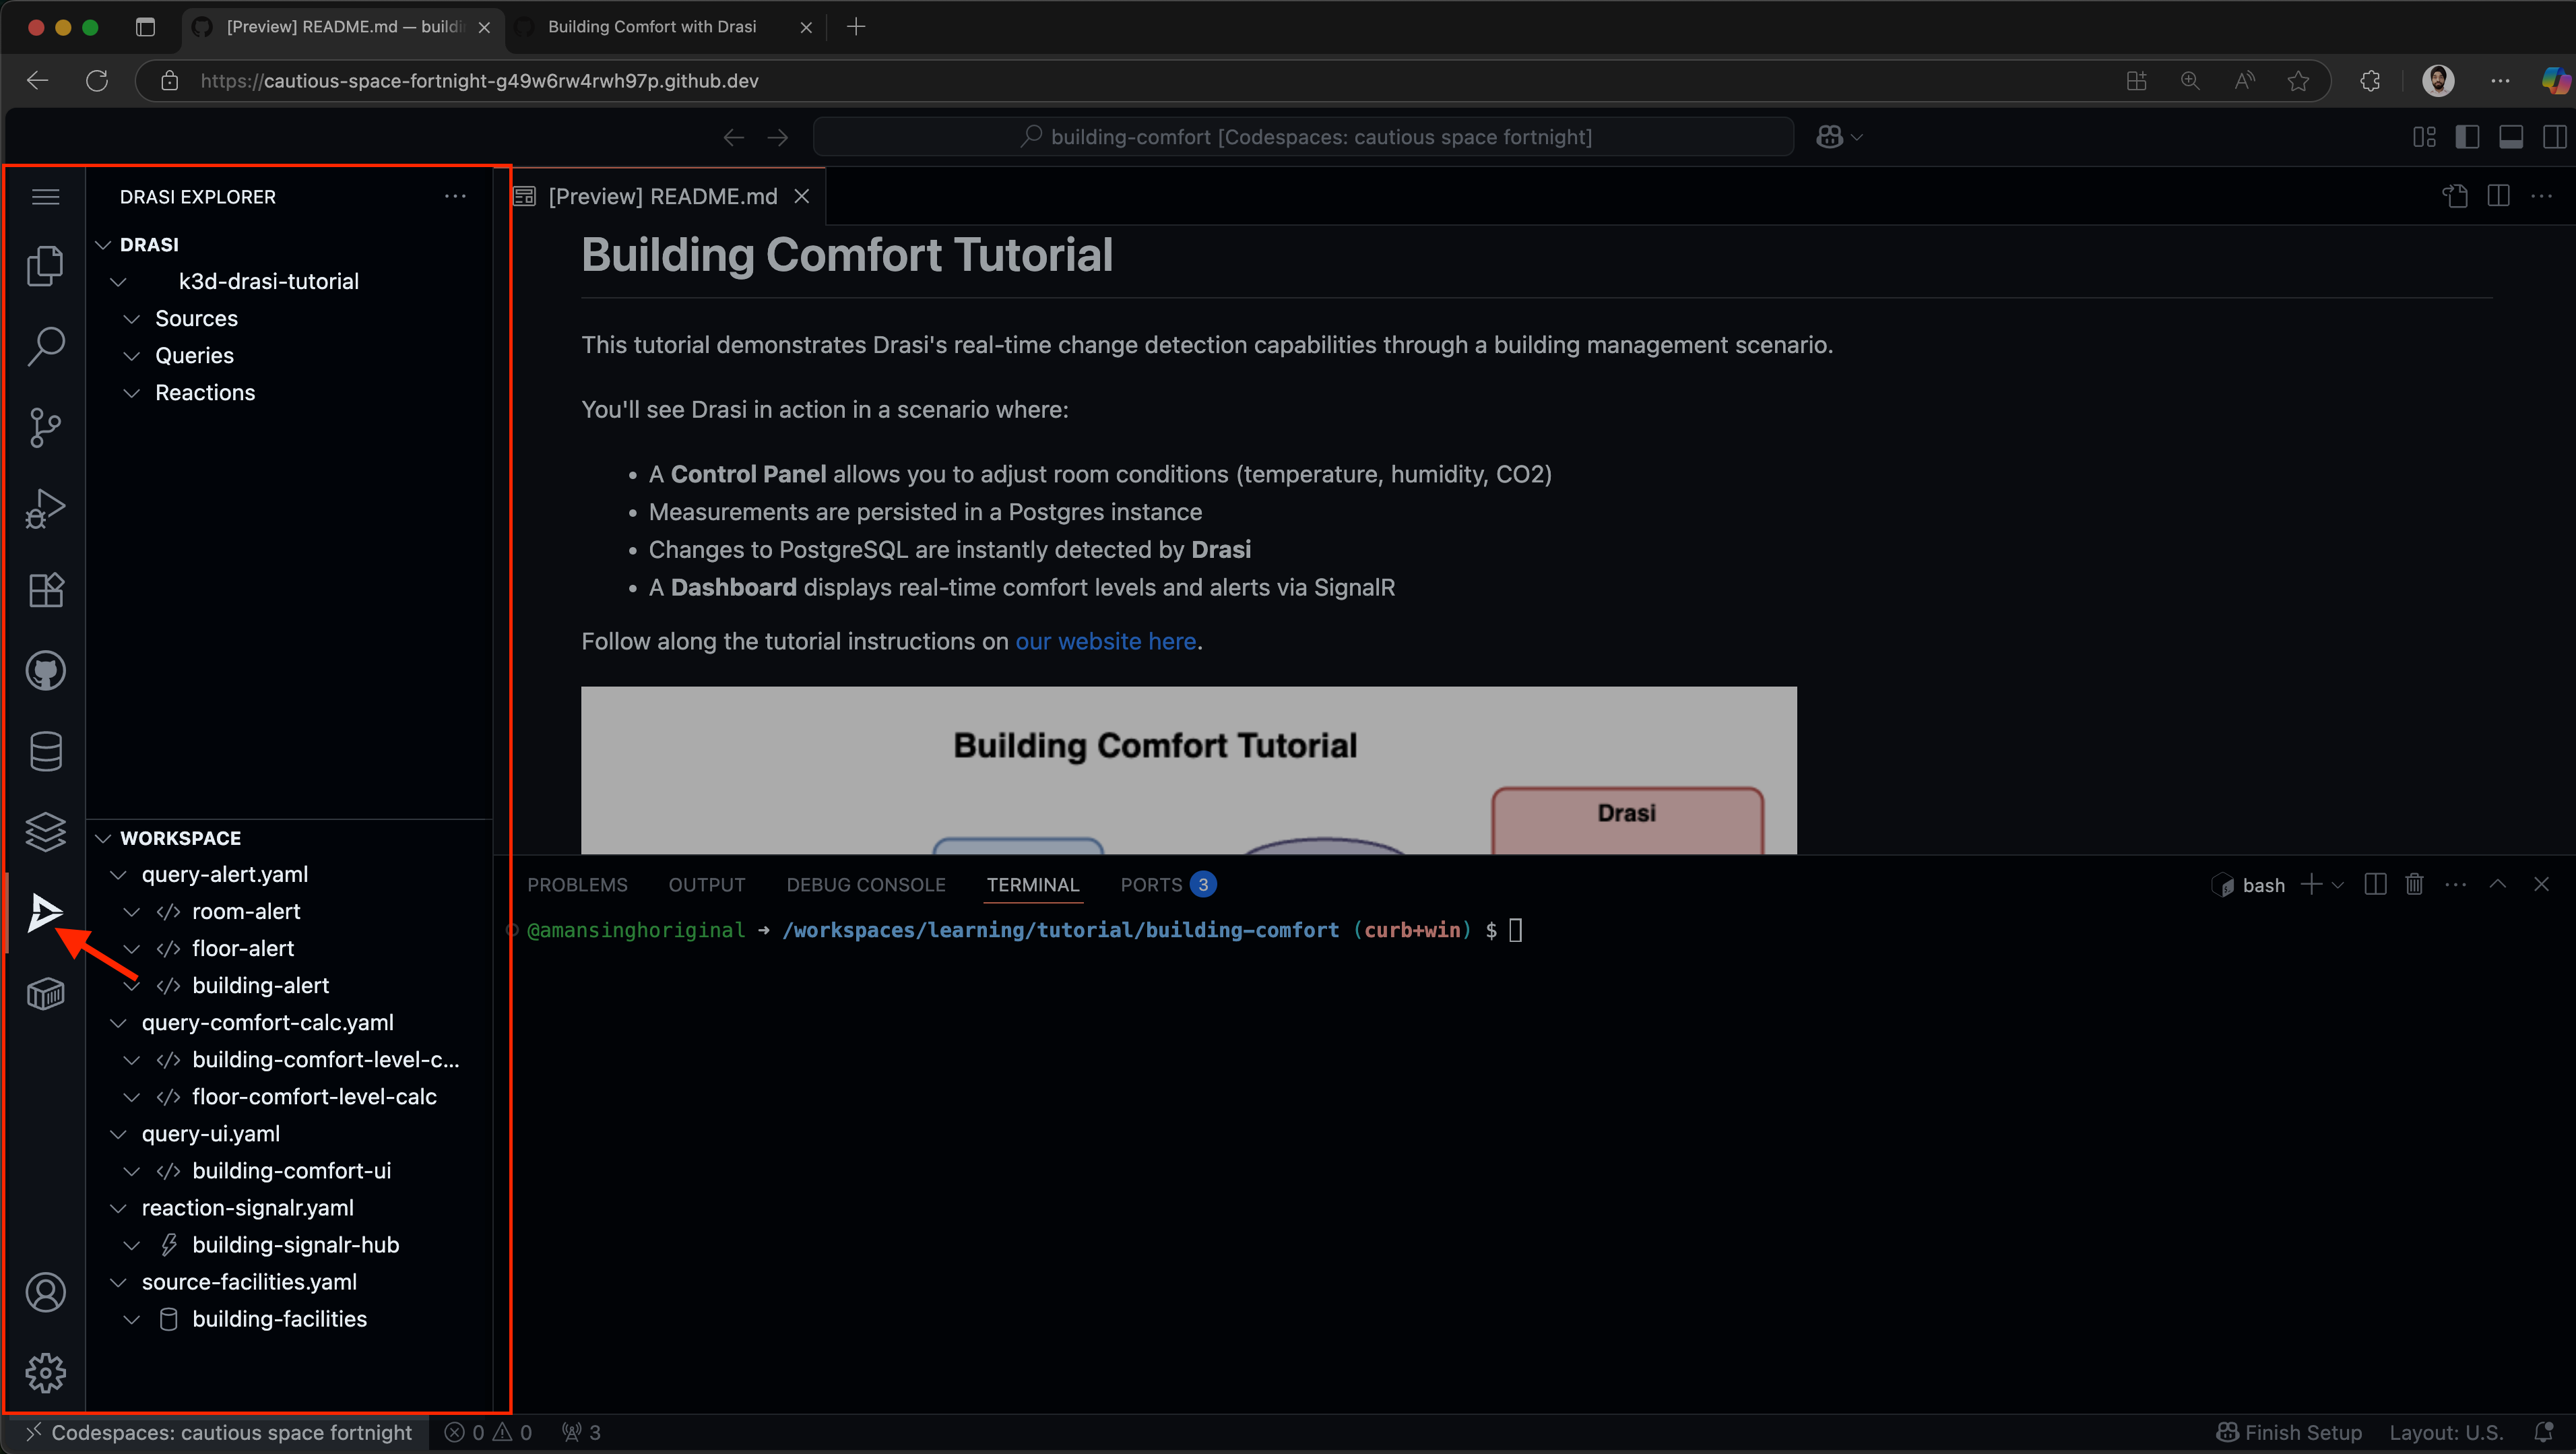
Your dev container already has the Drasi extension installed:
You can install the VSCode Extension by following the instructions here.
Note: If you are using VSCode and installing the extension, it is recommended to open the folder learning/tutorial/building-comfort in VSCode.
This is because the extension automatically lists all the Drasi YAMLs found in your workspace and the screenshots in the rest of this tutorial assume the set of YAMLs within the path mentioned earlier. If you have learning or other a different path opened in VSCode, you might see a different set of source, query and reaction YAMLs.
Drasi Source
Sources in Drasi provide connectivity to the systems that are sources of change. You can learn more about Drasi Sources here.
Navigate to the drasi directory within your workspace (tutorial/building-comfort/drasi):
cd drasi
We have provided a YAML file source-facilities.yaml that has the connection parameters for the postgreSQL database that stores the latest sensor measurements.
apiVersion: v1
kind: Source
name: building-facilities
spec:
  kind: PostgreSQL
  properties:
    host: postgres.default.svc.cluster.local
    port: 5432
    user: test
    password: test
    database: building-comfort-db
    ssl: false
    tables:
      - public.Building
      - public.Floor
      - public.Room
This YAML tells Drasi how to connect to the PostgreSQL database.
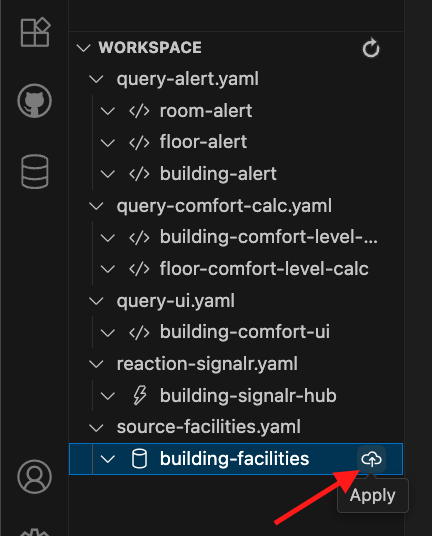
Find the source in the Workspace inside Drasi VSCode Extension as shown here, and click “Apply”:
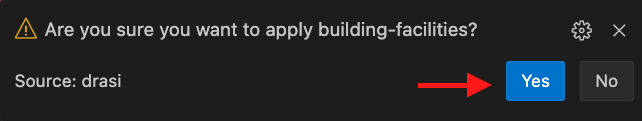
You will get a pop-up on the bottom right corner of your screen. Confirm if you want to deploy the source.
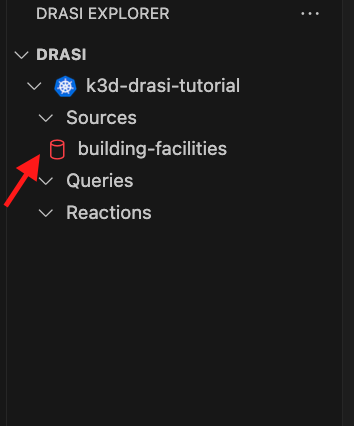
You will see the source with a Red icon - which means we need to wait for few seconds for the source to come online:
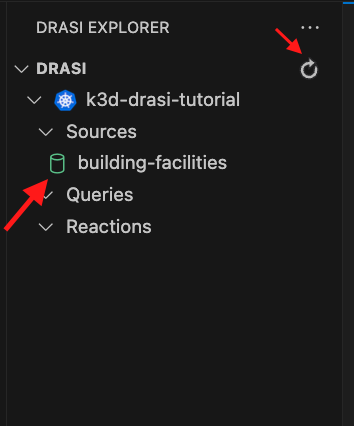
The source will show up with a Green icon when it is ready for use. Try the refresh button shown here if it does not become ready within a couple minutes:
Use the following commands to apply the source, and wait for it to come online:
drasi apply -f source-facilities.yaml
drasi wait source building-facilities -t 120
Verify the source is online:
drasi list source
The source should be listed with AVAILABLE set to true:
          ID          | AVAILABLE | MESSAGES
----------------------+-----------+-----------
  building-facilities | true      |
Continuous Queries
Continuous Queries are the mechanism by which you tell Drasi what changes to detect in source systems as well as the data you want distributed when changes are detected. You can read more about them here.
For our scenario, we have placed a few query YAML files inside the drasi subdirectory.
Query for the UI
Let’s write a query that provides all buildings, floors and rooms to the UI to create the dashboard.
    MATCH
      (r:Room)-[:PART_OF_FLOOR]->(f:Floor)-[:PART_OF_BUILDING]->(b:Building)
    WITH
      r,
      f,
      b,
      floor( 50 + (r.temperature - 72) + (r.humidity - 42) + CASE WHEN r.co2 > 500 THEN (r.co2 - 500) / 25 ELSE 0 END ) AS ComfortLevel
    RETURN
      r.id AS RoomId,
      r.name AS RoomName,
      f.id AS FloorId,
      f.name AS FloorName,
      b.id AS BuildingId,
      b.name AS BuildingName,
      r.temperature AS Temperature,
      r.humidity AS Humidity,
      r.co2 AS CO2,
      ComfortLevel
Synthetic Relationships
Note that in our Cypher query we want to relate the rooms to the floor and the building they are part of. This relation is expressed intuitively in the MATCH phrase of the Cypher query.
However, our existing datastore for sensor metrics may or may not have existing relationships. That is not a problem for Drasi because we can model “Synthetic Relationships” for use in our query.
We have the query for our UI defined in the file query-ui.yaml that provides all buildings, floors and rooms to the UI.
This query:
- Joins rooms to floors and buildings using synthetic relationships
- Calculates comfort level for each room
- Returns all data needed for the dashboard
The full YAML looks like this:
kind: ContinuousQuery
apiVersion: v1
name: building-comfort-ui
spec:
  mode: query
  sources:
    subscriptions:
      - id: building-facilities
        nodes:
          - sourceLabel: Room
          - sourceLabel: Floor
          - sourceLabel: Building
    joins:
      - id: PART_OF_FLOOR
        keys:
          - label: Room
            property: floor_id
          - label: Floor
            property: id
      - id: PART_OF_BUILDING
        keys:
          - label: Floor
            property: building_id
          - label: Building
            property: id
  query: >
    MATCH
      (r:Room)-[:PART_OF_FLOOR]->(f:Floor)-[:PART_OF_BUILDING]->(b:Building)
    WITH
      r,
      f,
      b,
      floor( 50 + (r.temperature - 72) + (r.humidity - 42) + CASE WHEN r.co2 > 500 THEN (r.co2 - 500) / 25 ELSE 0 END ) AS ComfortLevel
    RETURN
      r.id AS RoomId,
      r.name AS RoomName,
      f.id AS FloorId,
      f.name AS FloorName,
      b.id AS BuildingId,
      b.name AS BuildingName,
      r.temperature AS Temperature,
      r.humidity AS Humidity,
      r.co2 AS CO2,
      ComfortLevel
In the above query for instance, PART_OF_FLOOR is a synthetic relationship
that we use to inform Drasi that a room in the ‘Room’ table is connected to
(part-of) a floor in the ‘Floor’ table. This is specified in the joins
section of the YAML.
Likewise we have another synthetic relationship in the joins section for
PART_OF_BUILDING that connects floors to buildings.
Other Queries
The file query-comfort-calc.yaml has 2 queries for floor and building-level comfort calculations. These queries aggregate comfort levels at different levels of the building hierarchy.
The file query-alert.yaml has 3 queries to detect comfort level violations. These queries monitor when comfort levels go outside the acceptable range [40, 50]. The room-alert raises alerts for rooms out of range, floor-alert raises alerts for floors out of range, and building-alert raises alerts at the building level.
Deploying Queries
Find the query in the workspace inside Drasi VSCode Extension as shown here, and click “Apply”:
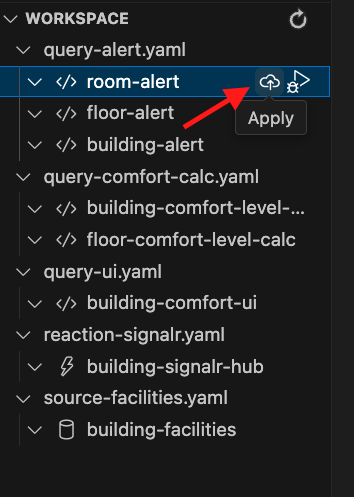
You will get a pop-up on the bottom right corner of your screen. Confirm if you want to deploy the query.
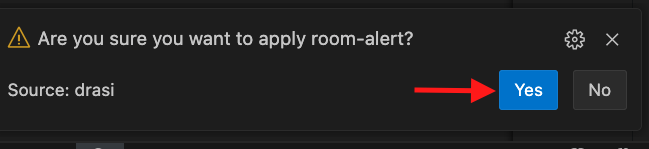
VS Code extension also allows you to debug queries and see their live result set. When you select the query, you can see its definition. And when you click on the debug button for the ui query:
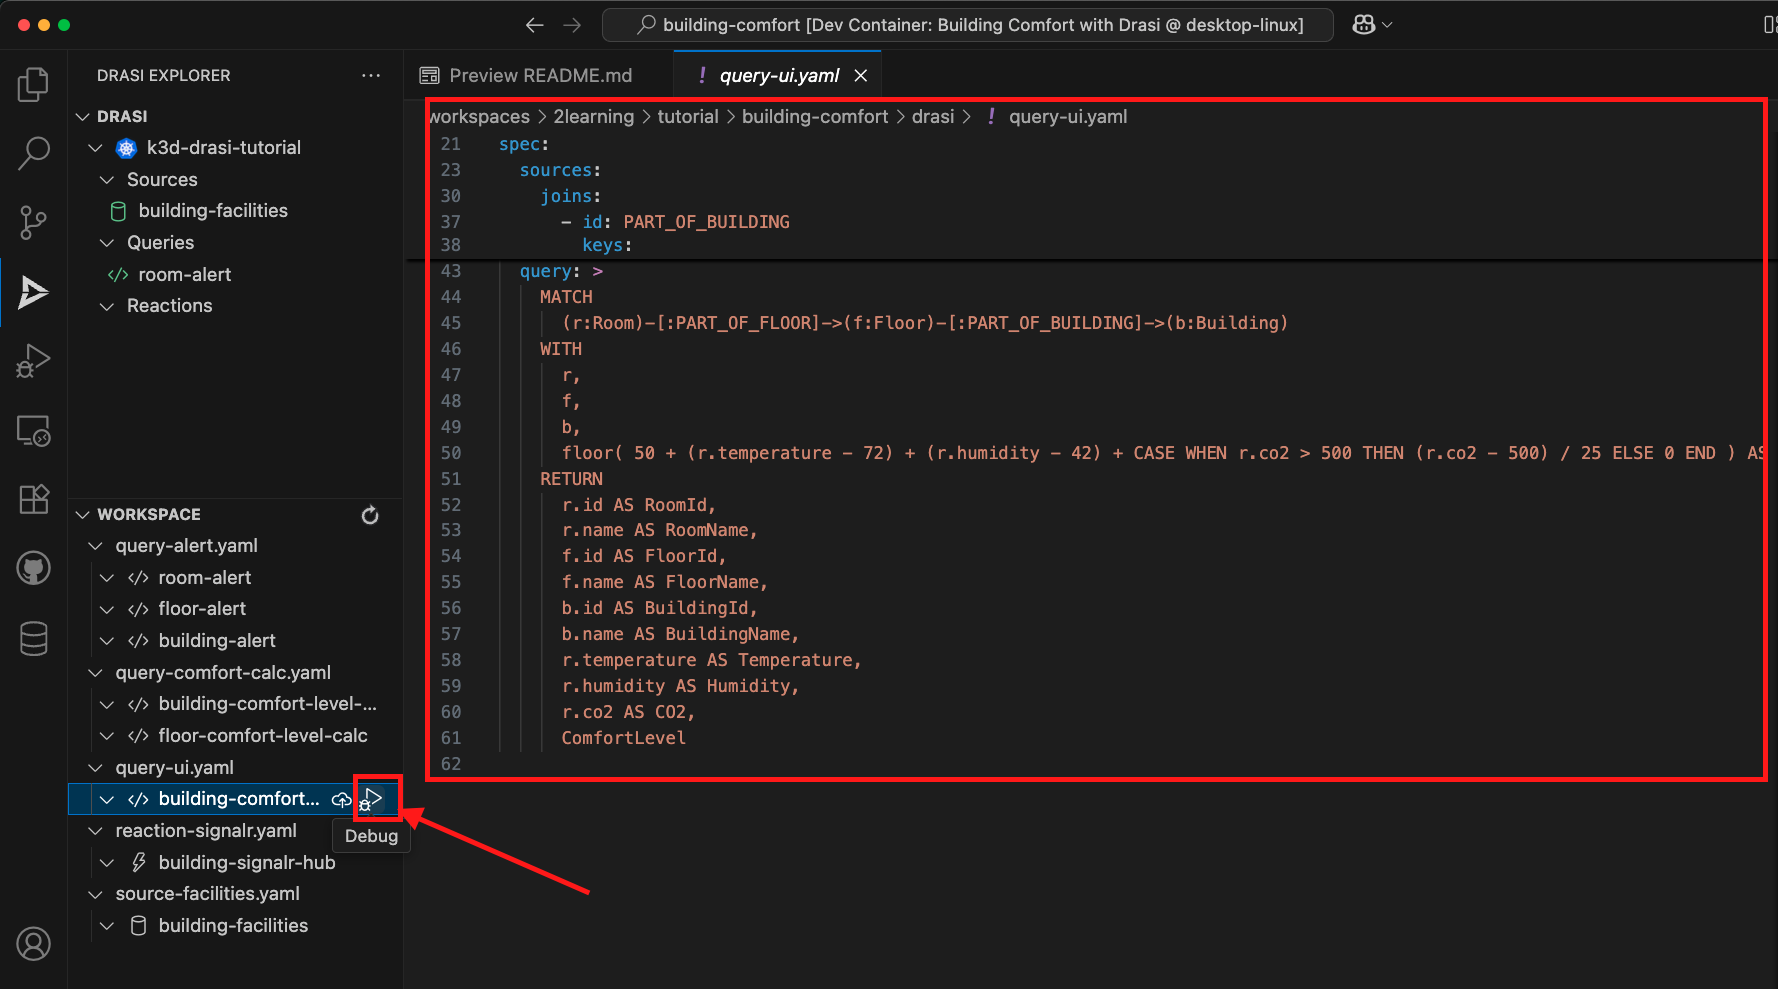
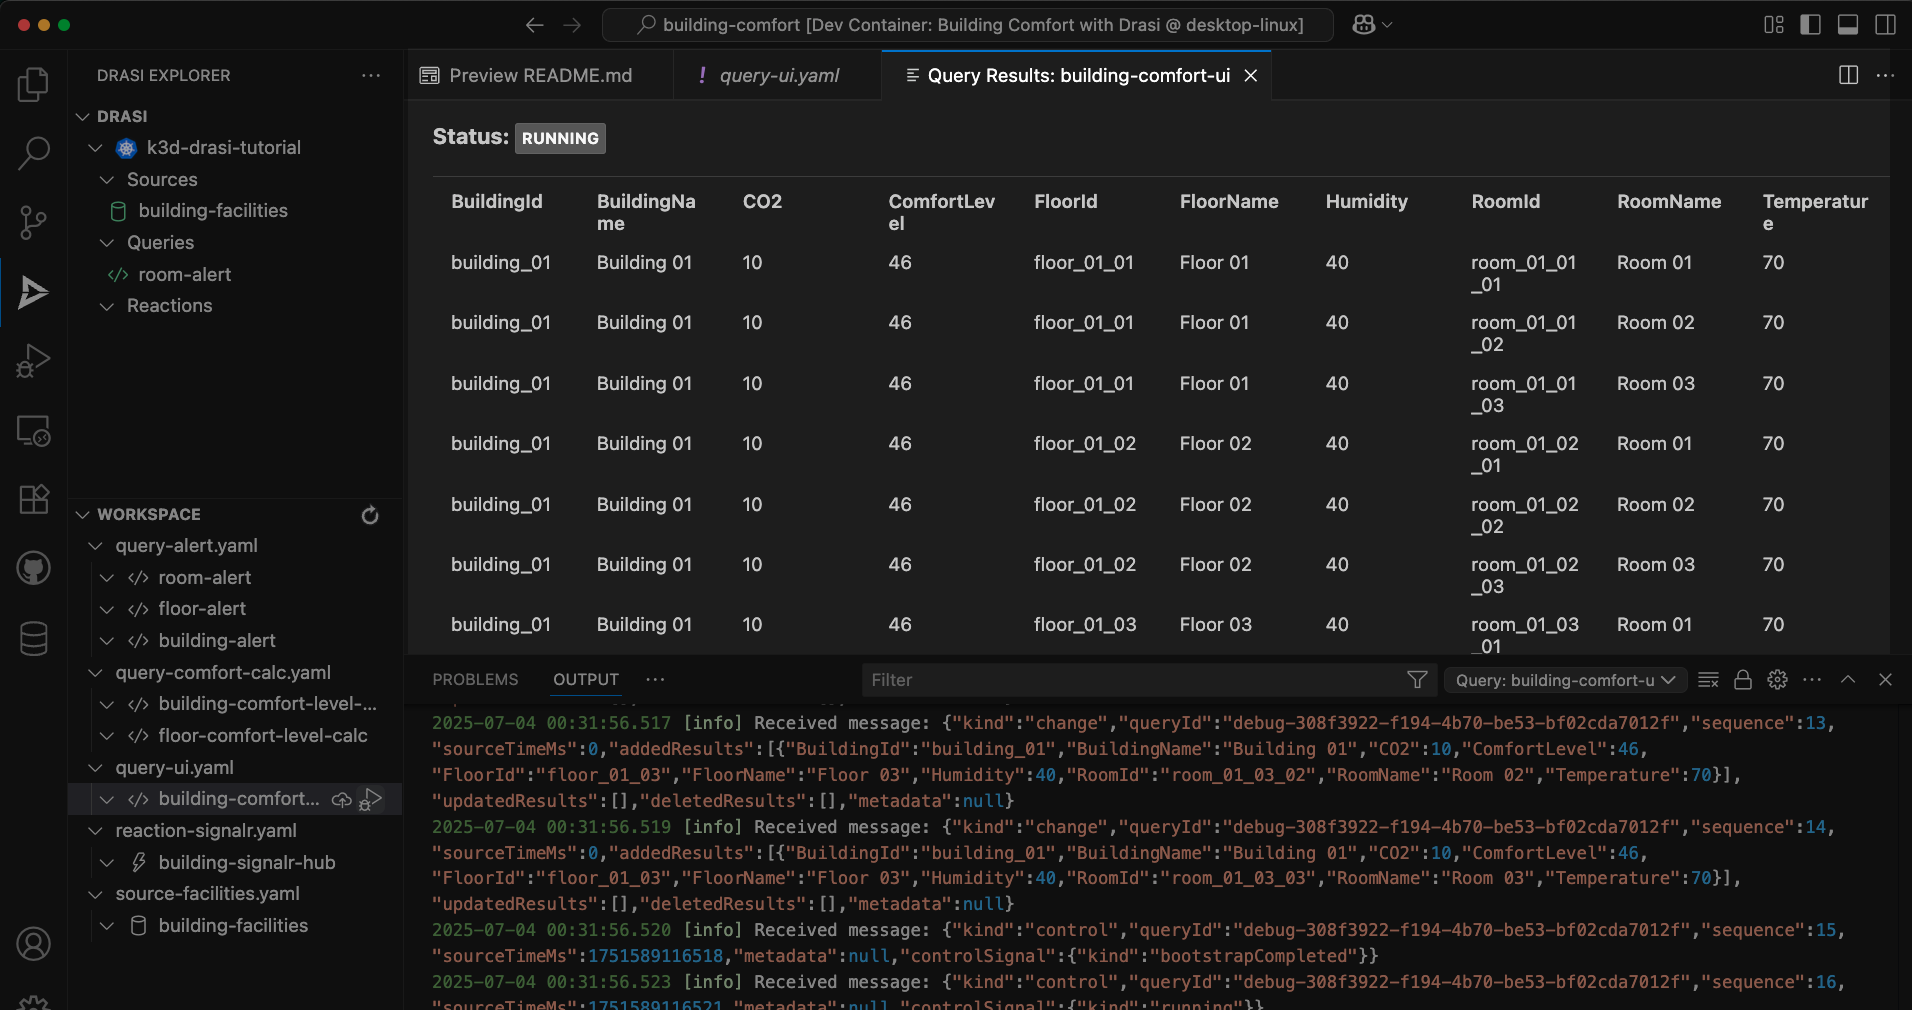
You can see the live result set maintained by the query like this:
Deploy all the 6 queries, and once they are all running, your Drasi extension should look like this:
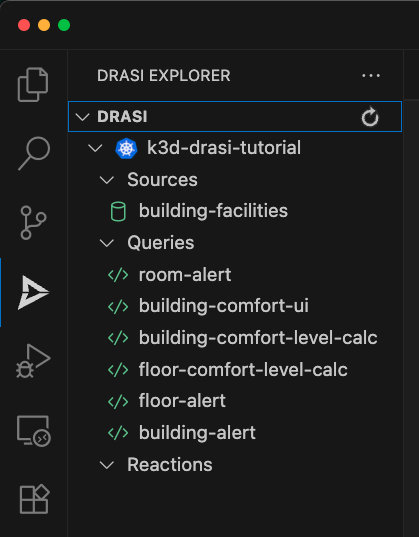
Apply all the queries to Drasi from the drasi directory within your workspace (tutorial/building-comfort/drasi)
drasi apply -f query-ui.yaml
drasi apply -f query-comfort-calc.yaml
drasi apply -f query-alert.yaml
Verify all queries are running:
drasi list query
You should see 6 queries total, and all of them in the running state:
              ID              | CONTAINER | ERRORMESSAGE |              HOSTNAME               | STATUS
------------------------------+-----------+--------------+-------------------------------------+----------
  room-alert                  | default   |              | default-query-host-6775c649fd-k9ccr | Running
  building-alert              | default   |              | default-query-host-6775c649fd-k9ccr | Running
  floor-alert                 | default   |              | default-query-host-6775c649fd-k9ccr | Running
  building-comfort-level-calc | default   |              | default-query-host-6775c649fd-k9ccr | Running
  floor-comfort-level-calc    | default   |              | default-query-host-6775c649fd-k9ccr | Running
  building-comfort-ui         | default   |              | default-query-host-6775c649fd-k9ccr | Running
SignalR Reaction
Reactions process the stream of query result changes output by one or more Drasi Queries and act on them. You can read more about Drasi Reactions here.
For our scenario, we will use the SignalR reaction, which provides access to the result set maintained by Drasi queries through a web socket server. It comes with React & Vue components that make it easy to develop reactive dashboards.
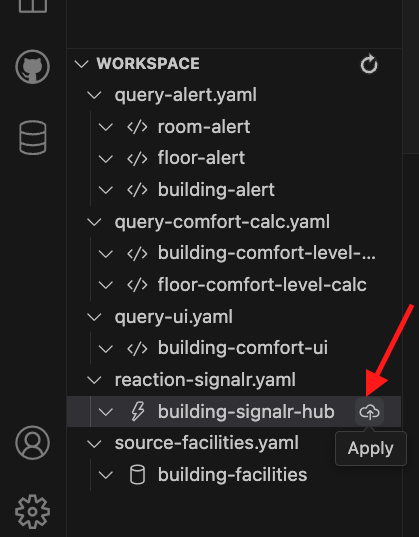
Find the reaction in the Workspace inside Drasi VSCode Extension as shown here, and click “Apply”:
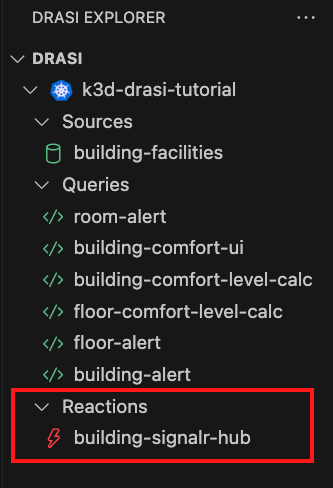
You will notice the reaction deploying. The red icon means that it is not ready yet. Wait for the reaction to get fully deployed.
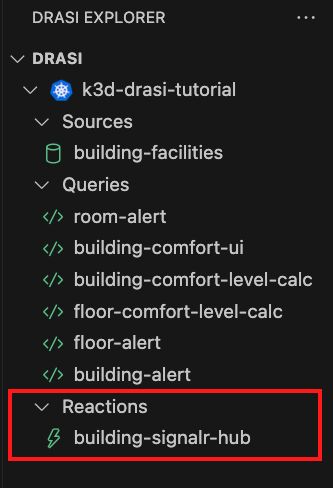
Once the reaction is ready, the icon will turn green like this:
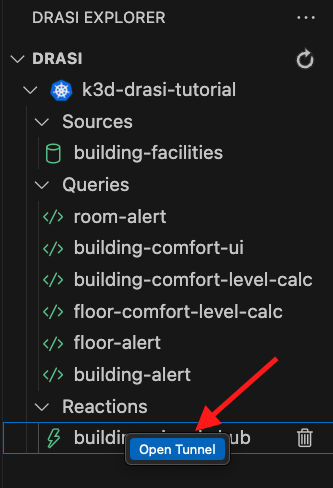
Now you have a websocket server up & running inside the Drasi Cluster. Since our frontend dashboard will be running on localhost, we need to create a tunnel. For this, Right Click on the reaction and select Open Tunnel as shown here:
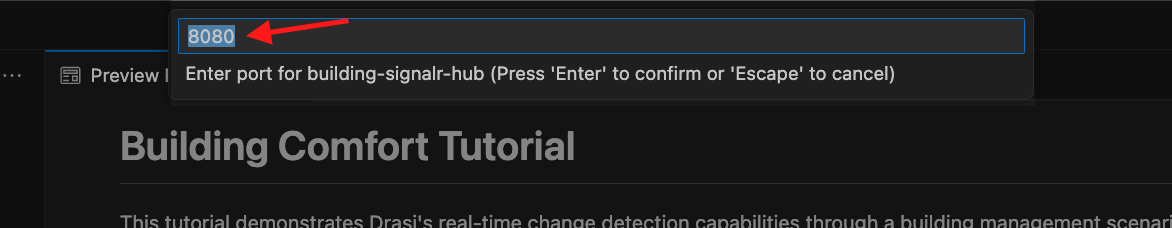
You will get a prompt to specify the port number. We have setup the dashboard to expect signalR hub at port 8080. Therefore, please set the value as 8080 here as shown here:
Deploy the SignalR reaction:
drasi apply -f reaction-signalr.yaml
drasi wait reaction building-signalr-hub -t 120
Verify the reaction is online:
drasi list reaction
The output should be something like this:
           ID          | AVAILABLE | MESSAGES
-----------------------+-----------+-----------
  building-signalr-hub | true      |
Now you have a websocket server up & running inside the Drasi Cluster. Since our frontend dashboard will be running on localhost, we need to create a tunnel. Use the following long-running command to create a tunnel. Note: Keep this running, as long as you want the dashboard to be live.
drasi tunnel reaction building-signalr-hub 8080
Port Forwarding
Drasi is running inside a k3d cluster inside your github codespaces container.
The Drasi tunnel for SignalR reaction has made the port accessible inside the codespace at port 8080.
The dashboard will however run your local browser. Github codespaces automatically would have forwarded port 8080.
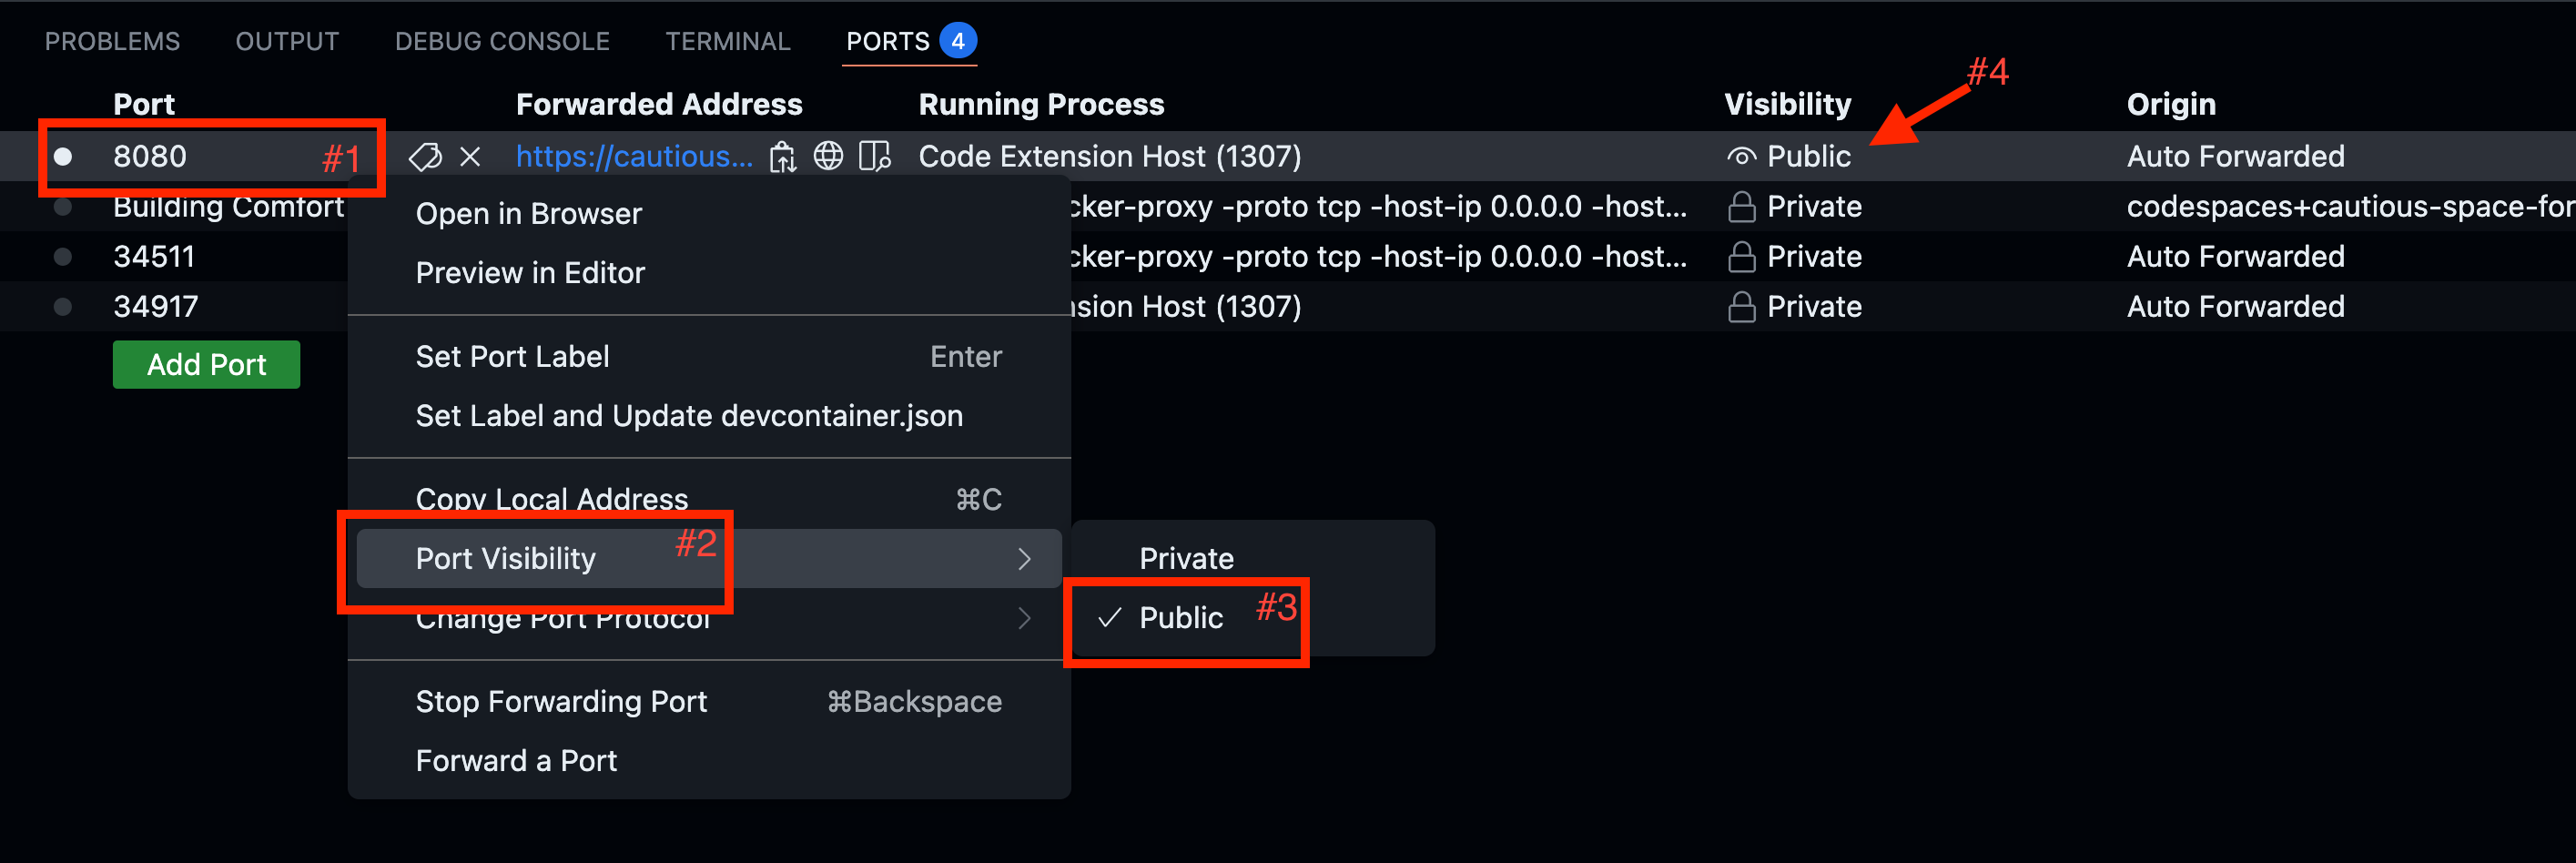
Note: Please make the port visibility as public:
- Go to the PORTS tab in VS Code and Right click on port 8080
- Select Port Visibility
- Mark it as public
- Make sure that the port is marked as Public.
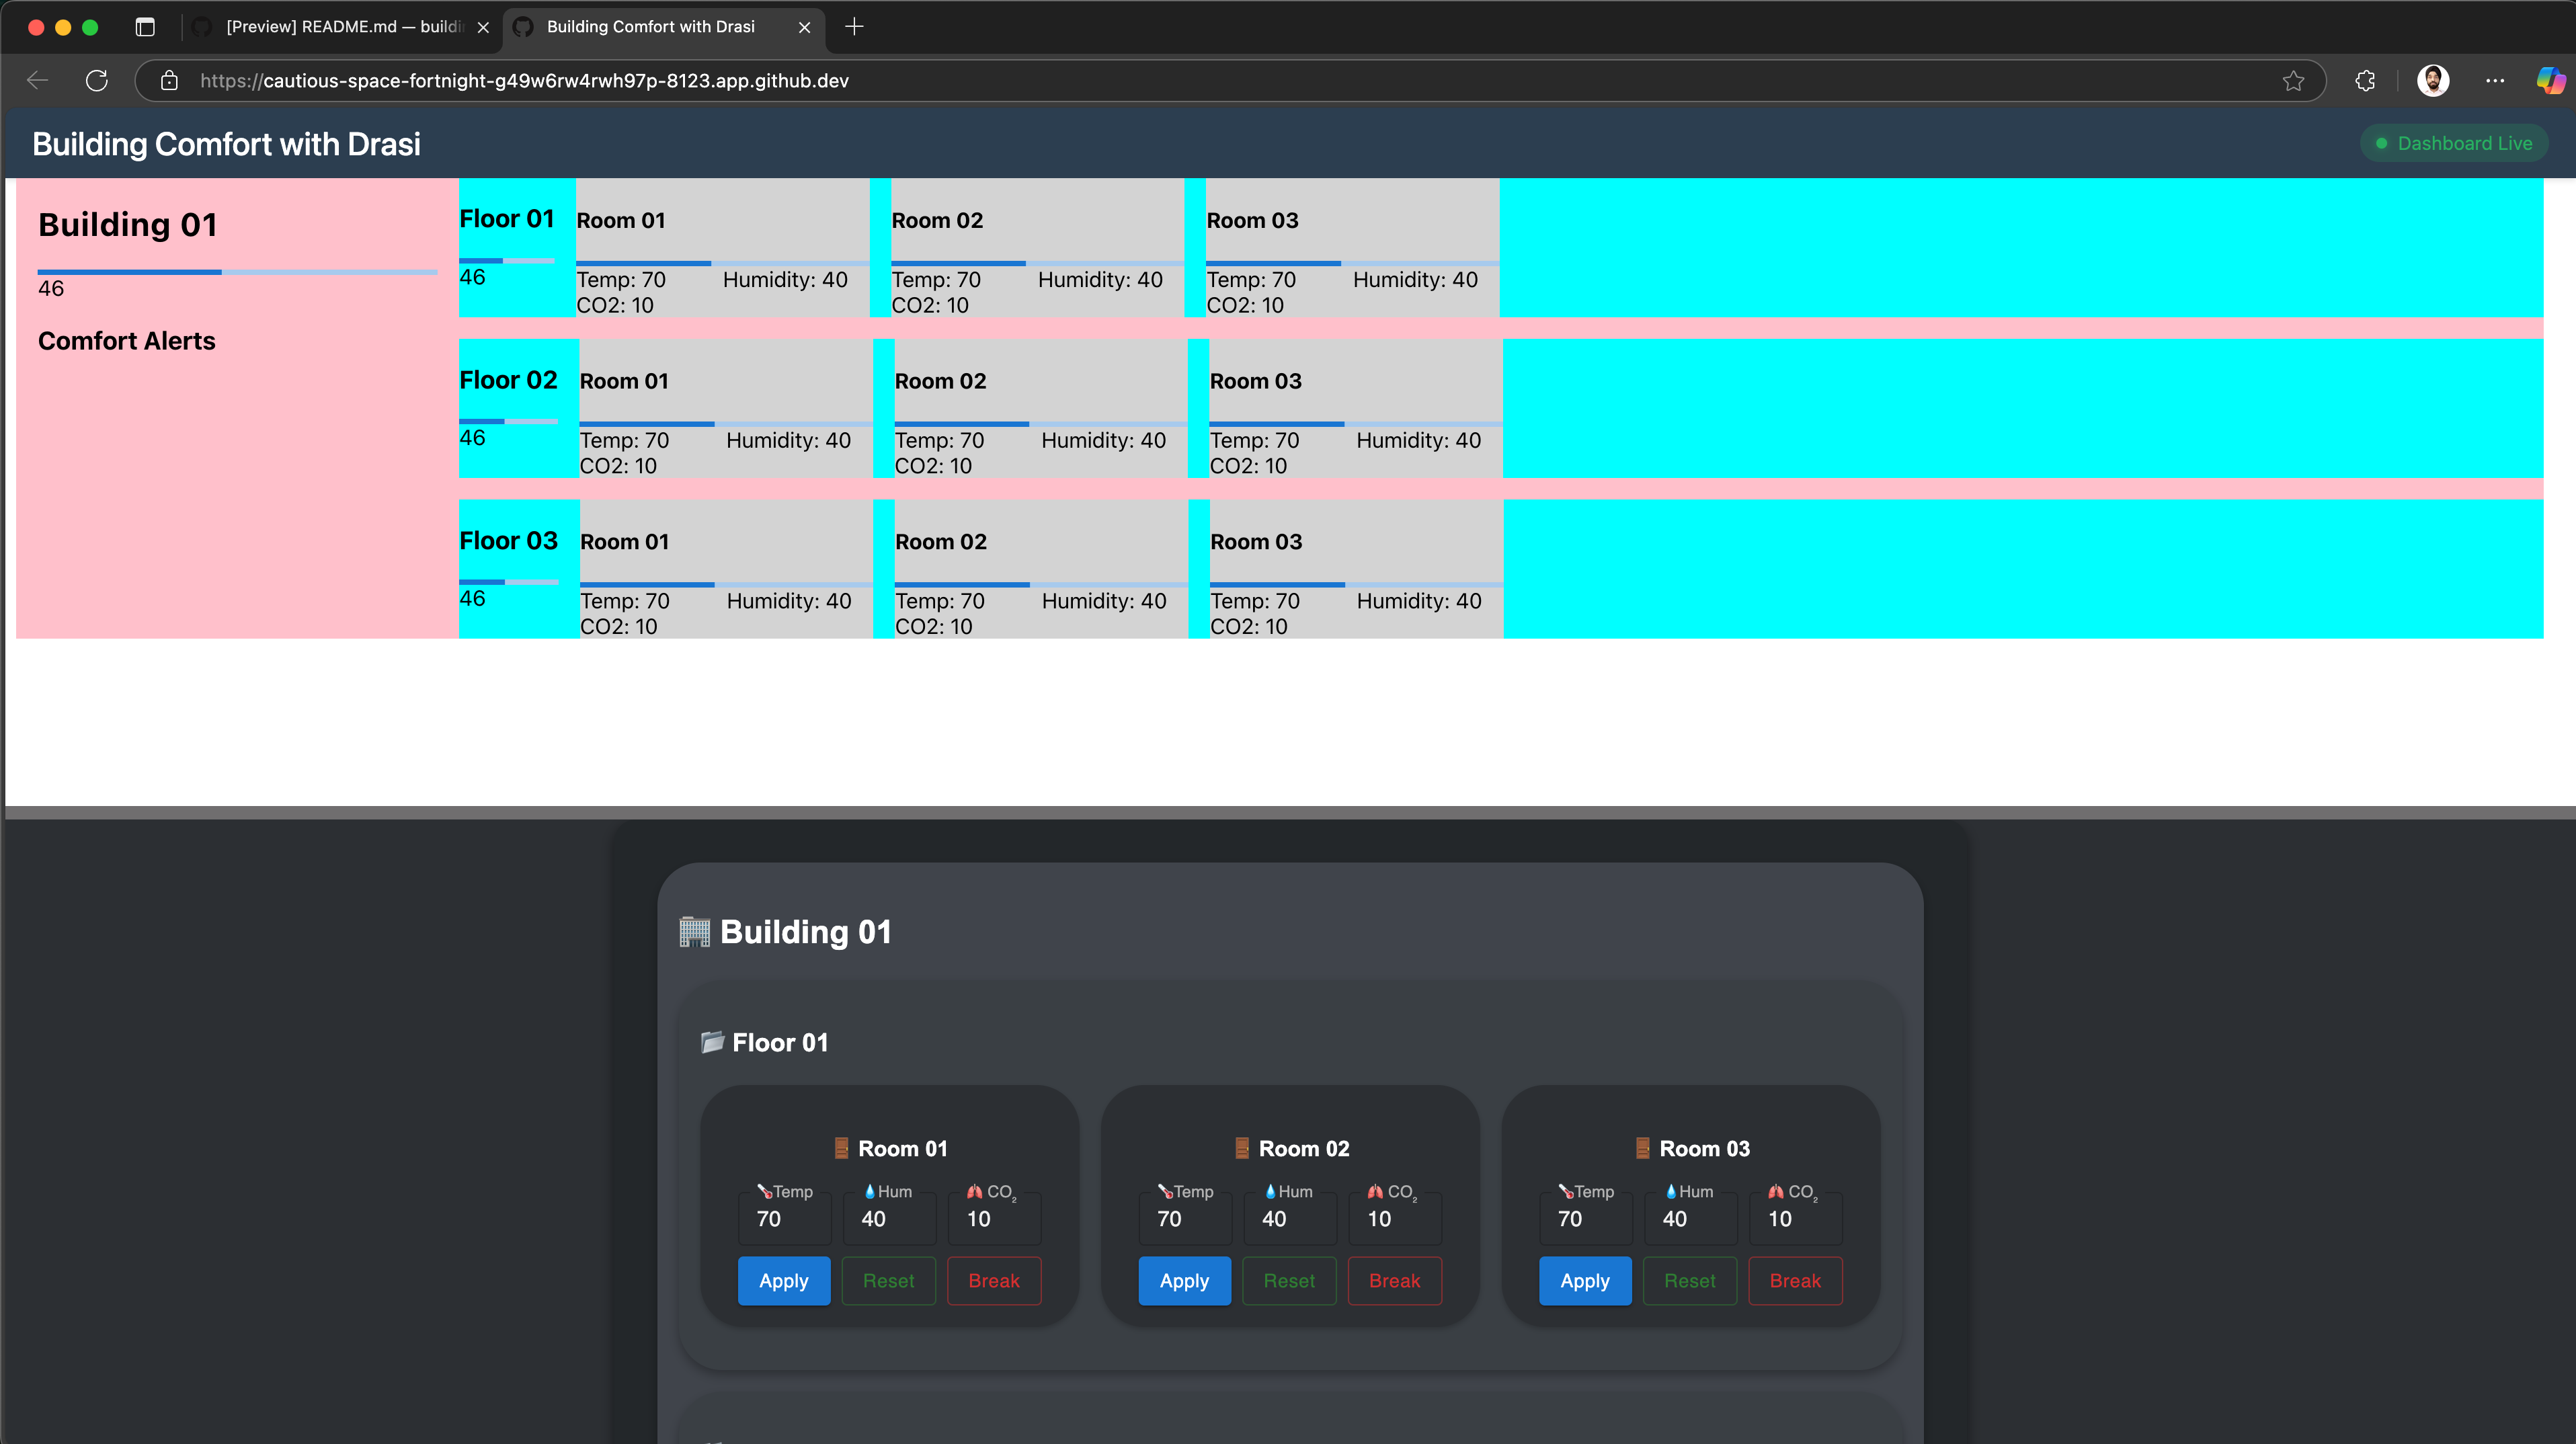
The demo should now be accessible at https://<your-codespace-id>-8123.app.github.dev/, and it should look like this:
Drasi is running inside a k3d cluster inside your github codespaces container.
The Drasi tunnel for SignalR reaction has made the port accessible inside the codespace at port 8080.
The dashboard will however run your local browser. VS Code usually forwards port 8080 to the same port on localhost automatically.
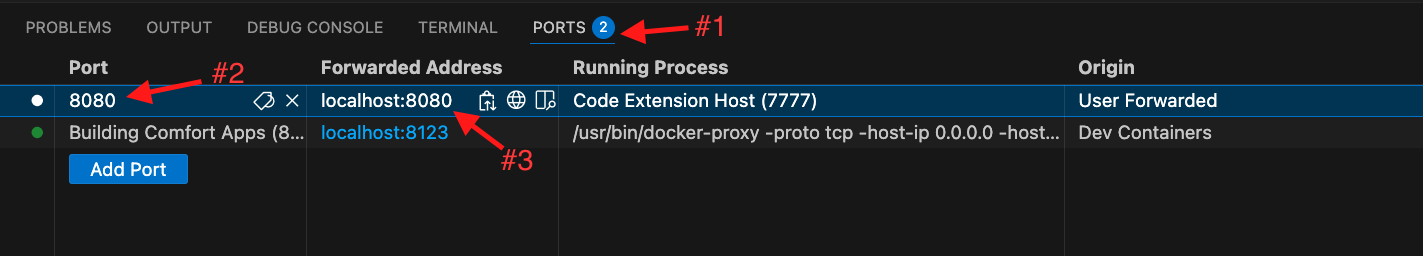
Note: Please make sure that port 8080 is forwarded to 8080 on localhost:
- Go to the PORTS tab in VS Code
- Make sure an entry for port 8080 exists
- Make sure that it is forwarded to port 8080 on localhost.
The demo should now be accessible at http://localhost:8123/, and it should look like this:
No need to port forward. The Drasi Tunnel should already make your signalR reaction available in your machine at local port 8080.
The demo should now be accessible at http://localhost:8123/, and it should look like this:
Testing the Reactiveness
Open the demo portal to see both the dashboard and control panel together. Try these scenarios:
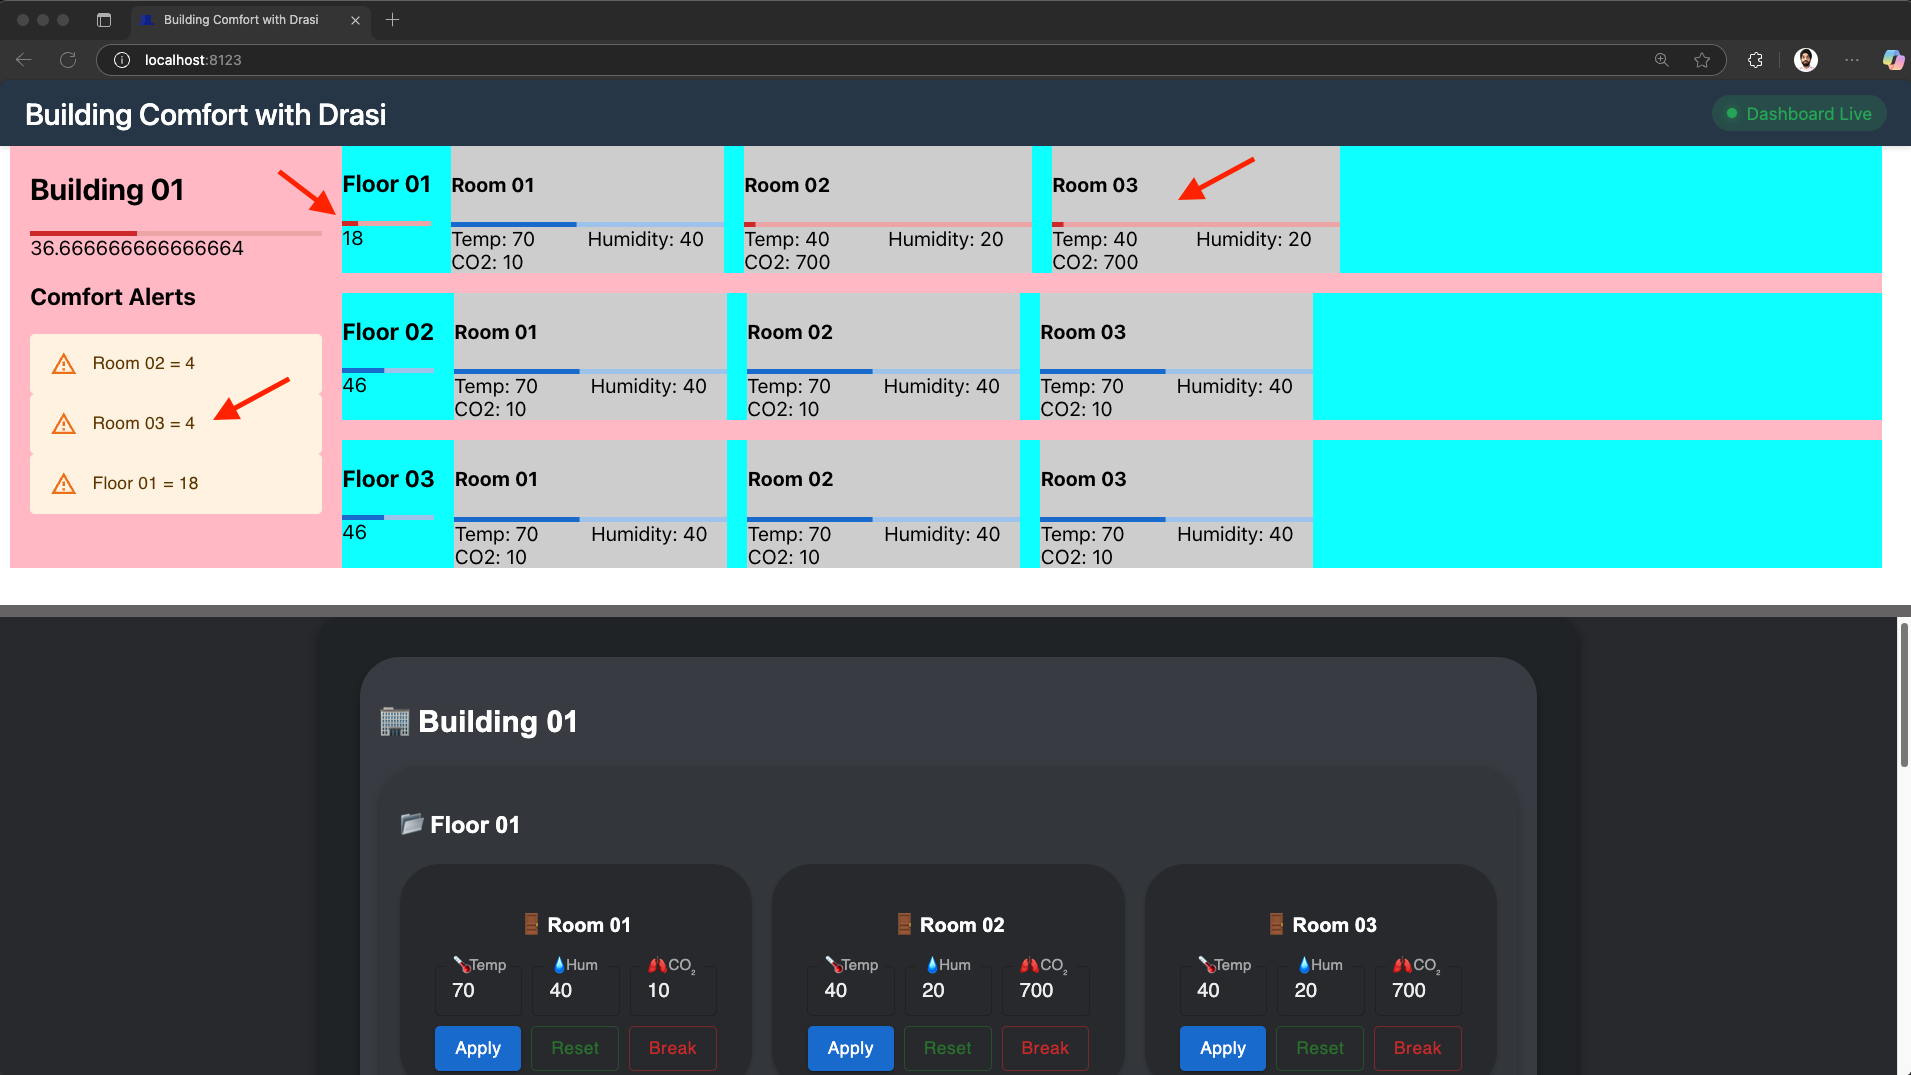
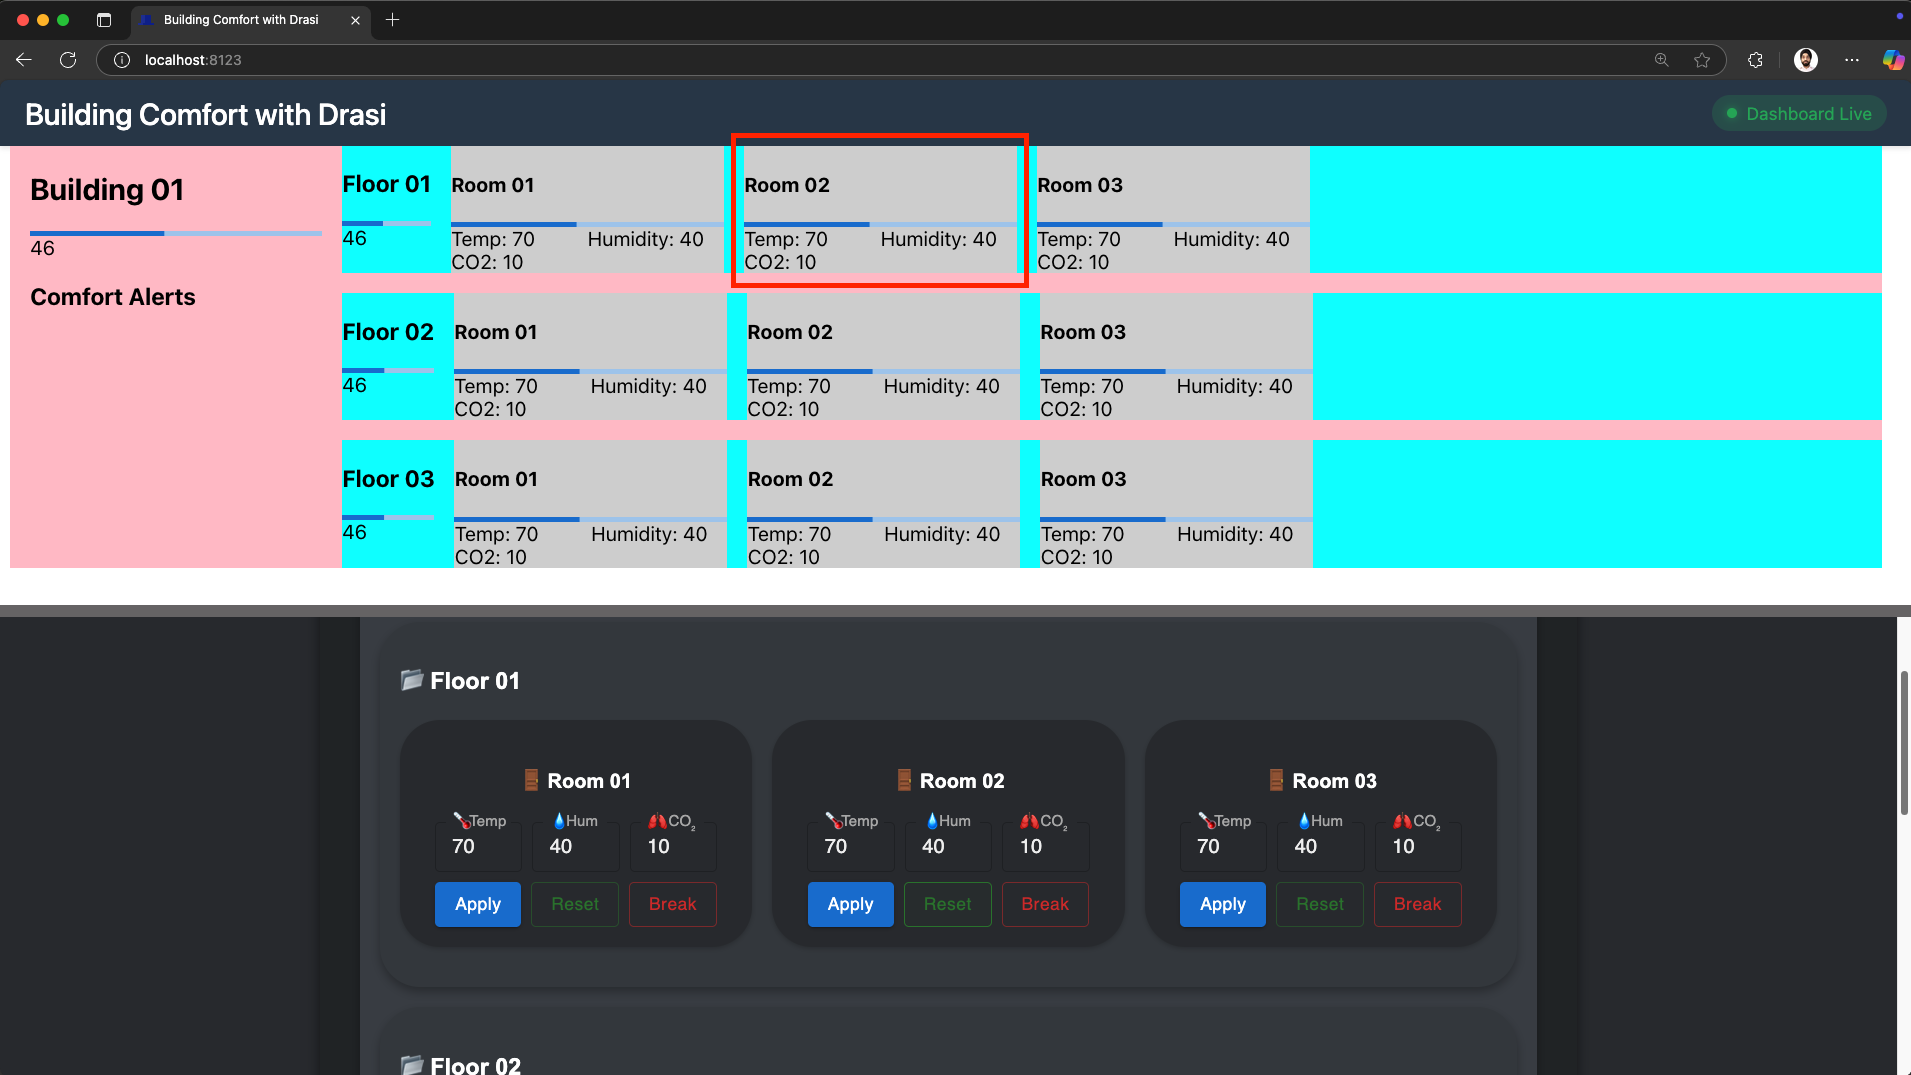
- Break a Room:
- Focus on the lower frame on the demo page which has the control panel.
- Find the controls for
Building 01→Floor 01→Room 02. - Click the “Break” button as shown in the screenshot below:
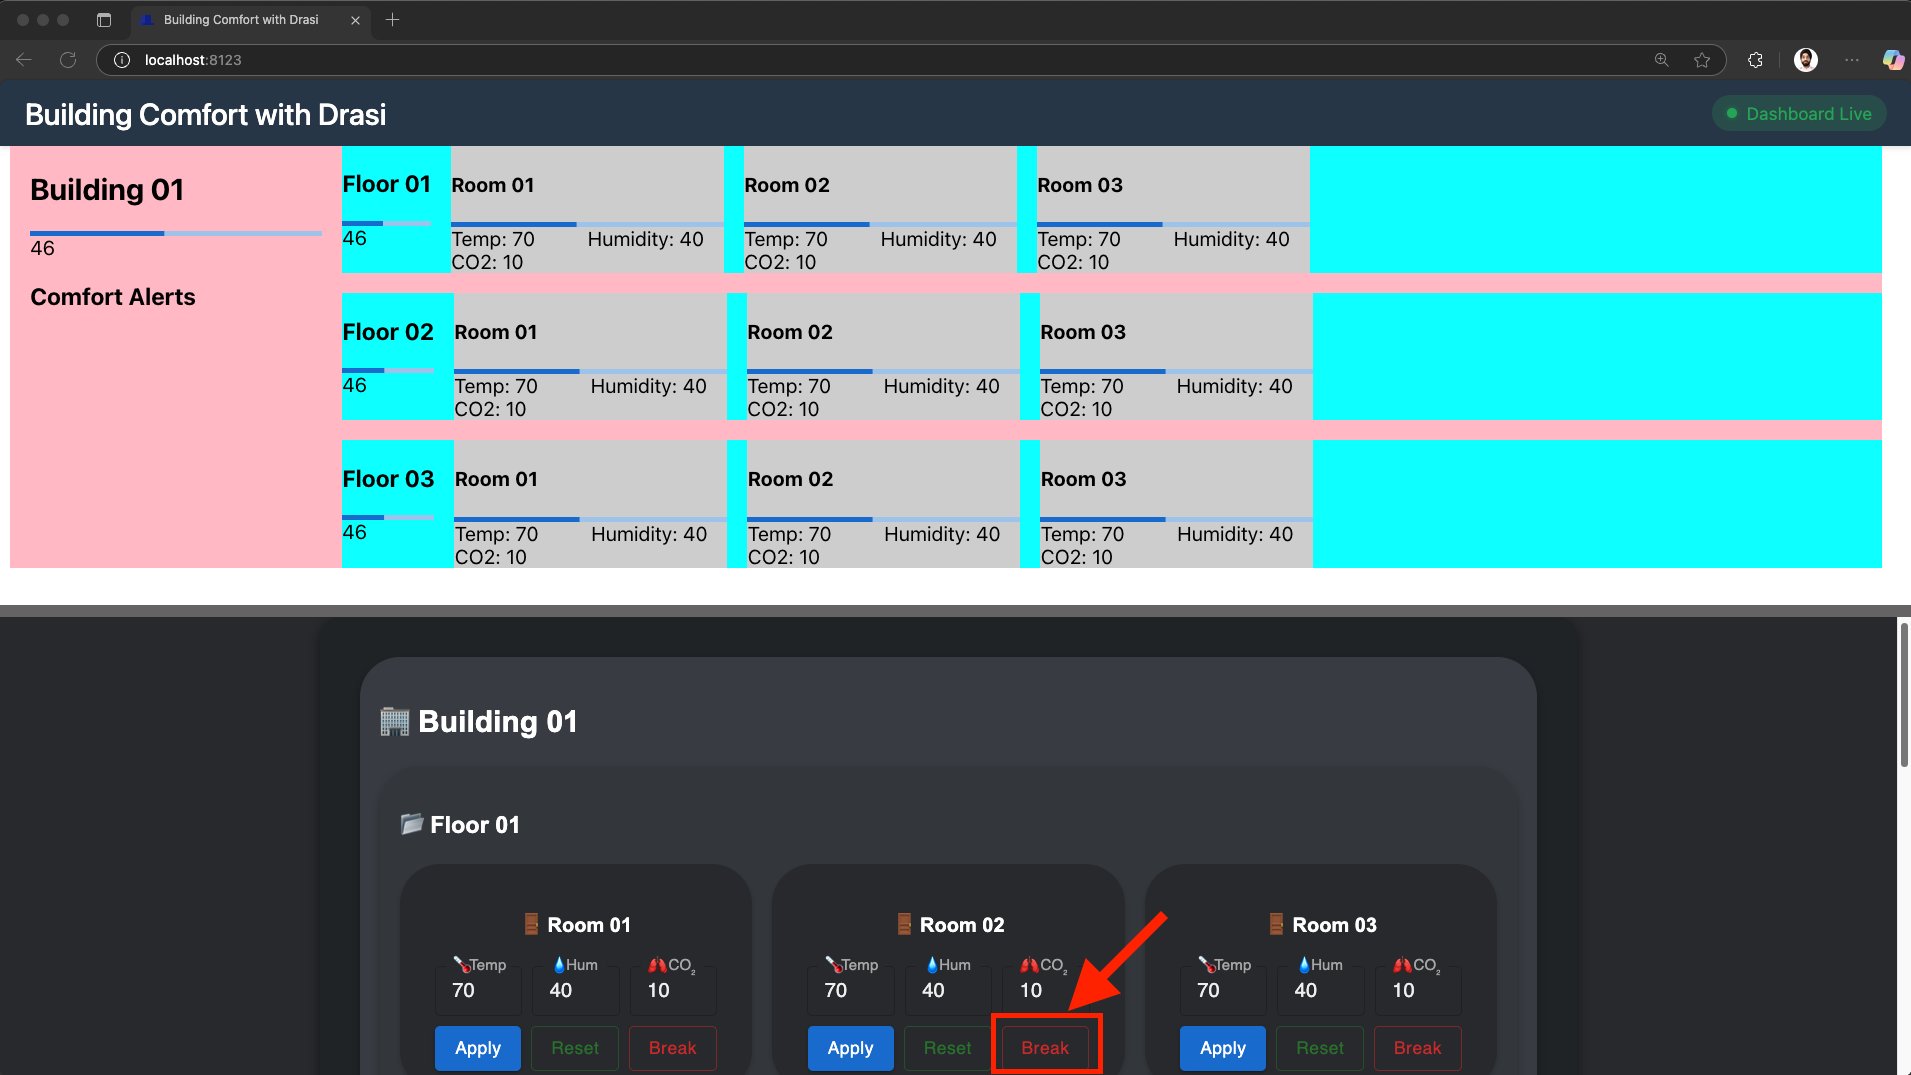
- This button adjusts the values for the room’s sensors
- Within a couple seconds you should see the room’s indicator turn red
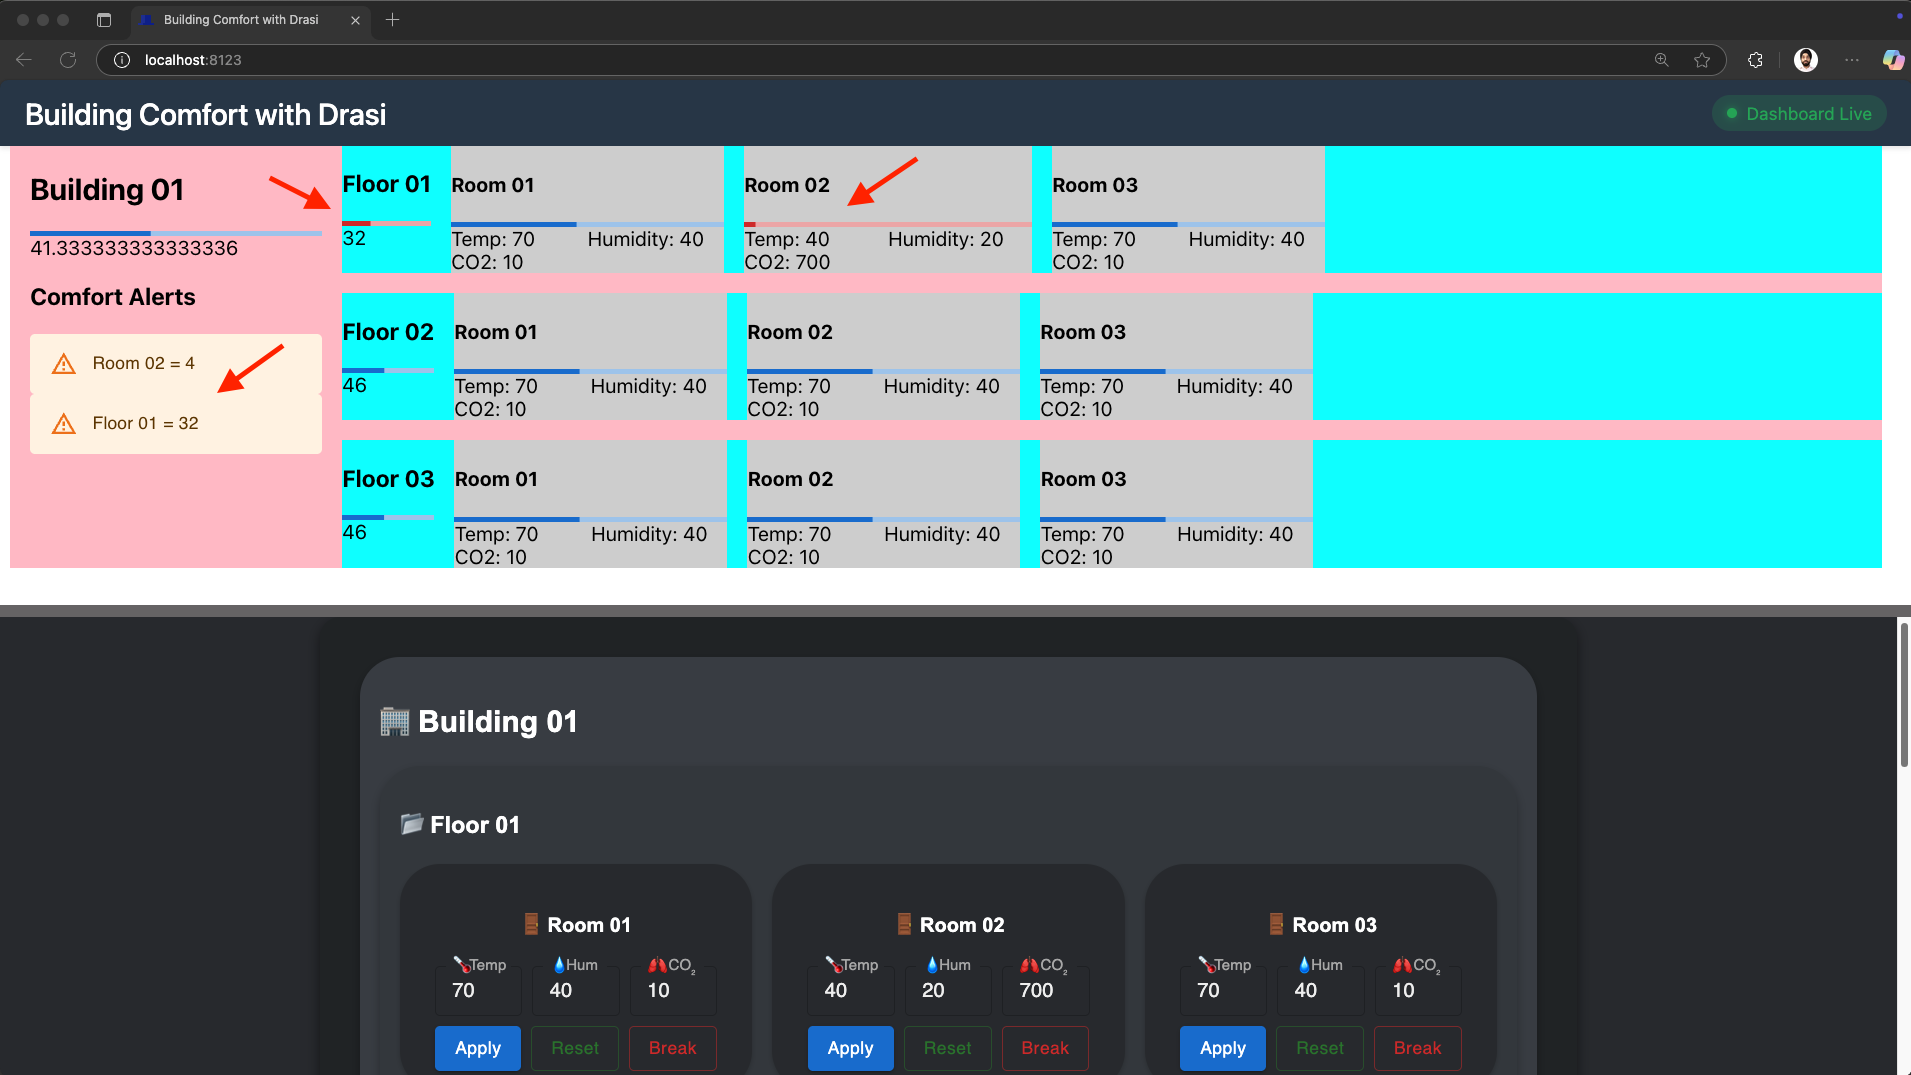
- As the screenshot below shows, the average comfort level of
Floor 01andBuilding 01also drops - In the (yellow) Alerts section on the left, we see two alerts - one for
Room 02and another forFloor 01both of which are now out of comfortable range.
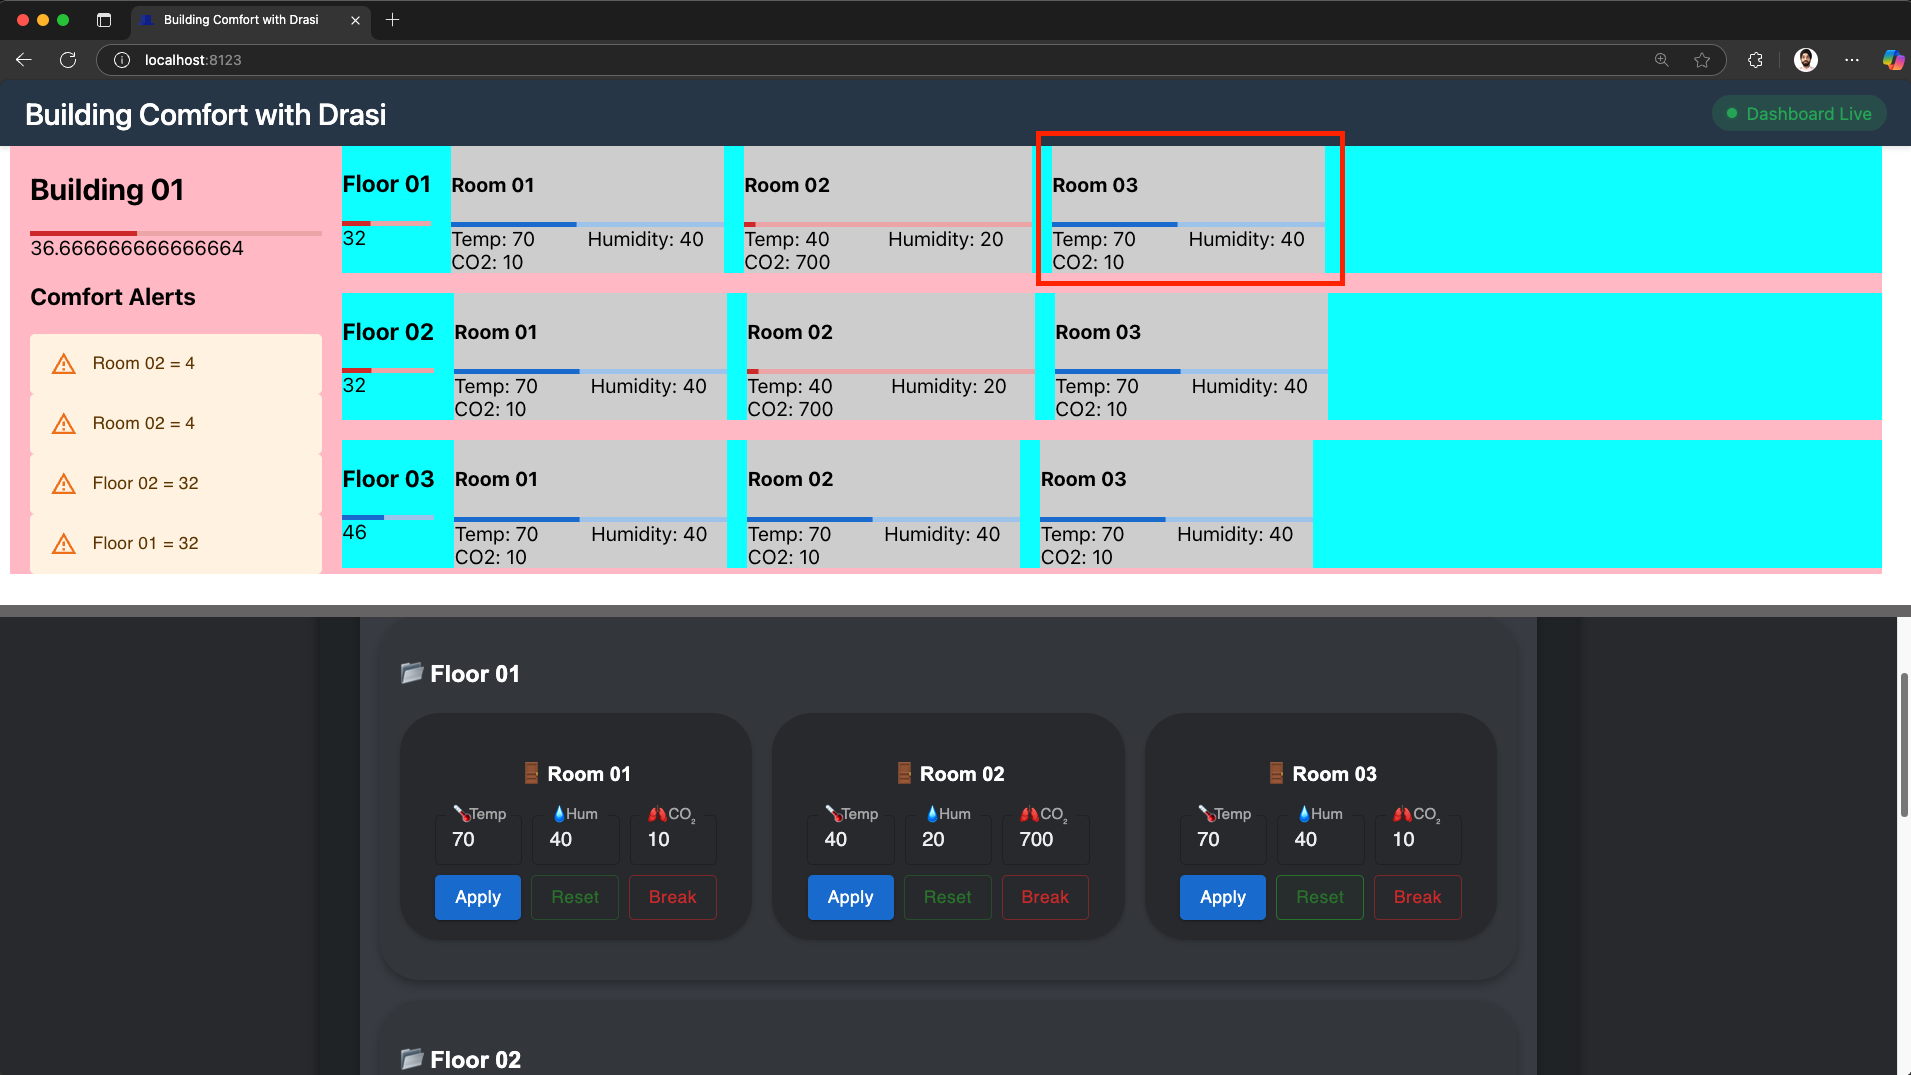
- Trying Break another Room:
- Next find the controls for
Building 01→Floor 01→Room 03in the Control Panel. - Click the “Break” button for Room 03 for Floor 01 as shown in screenshot below.

- See the reactiveness again, as within a couple of seconds, both rooms showing their own alerts.
- As the screenshot below shows, the average comfort level of
Floor 01andBuilding 01also drops further. - The comfort level of
Floor 01drops further down to 18 from the previous value of 32. - In the (yellow) Alerts section on the left, we see an additional alert for
Room 03which is now also out of comfortable range.
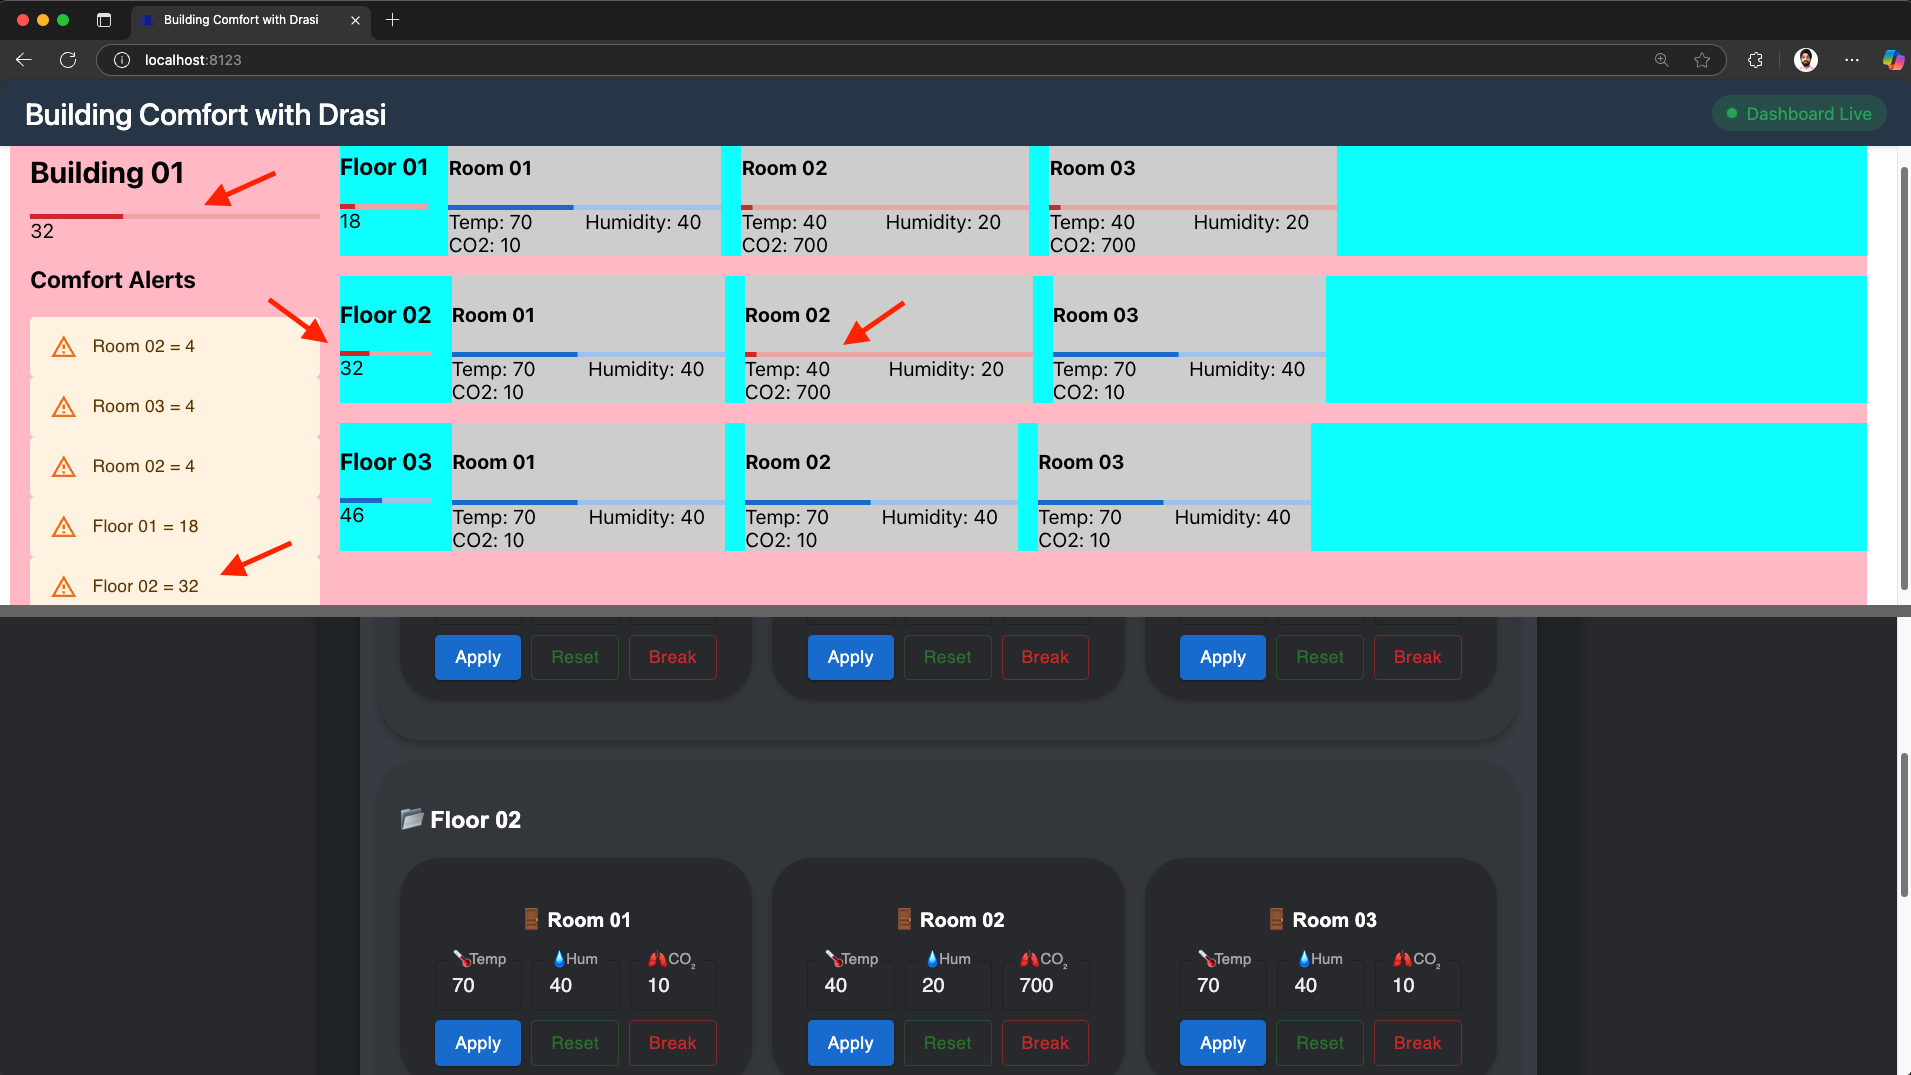
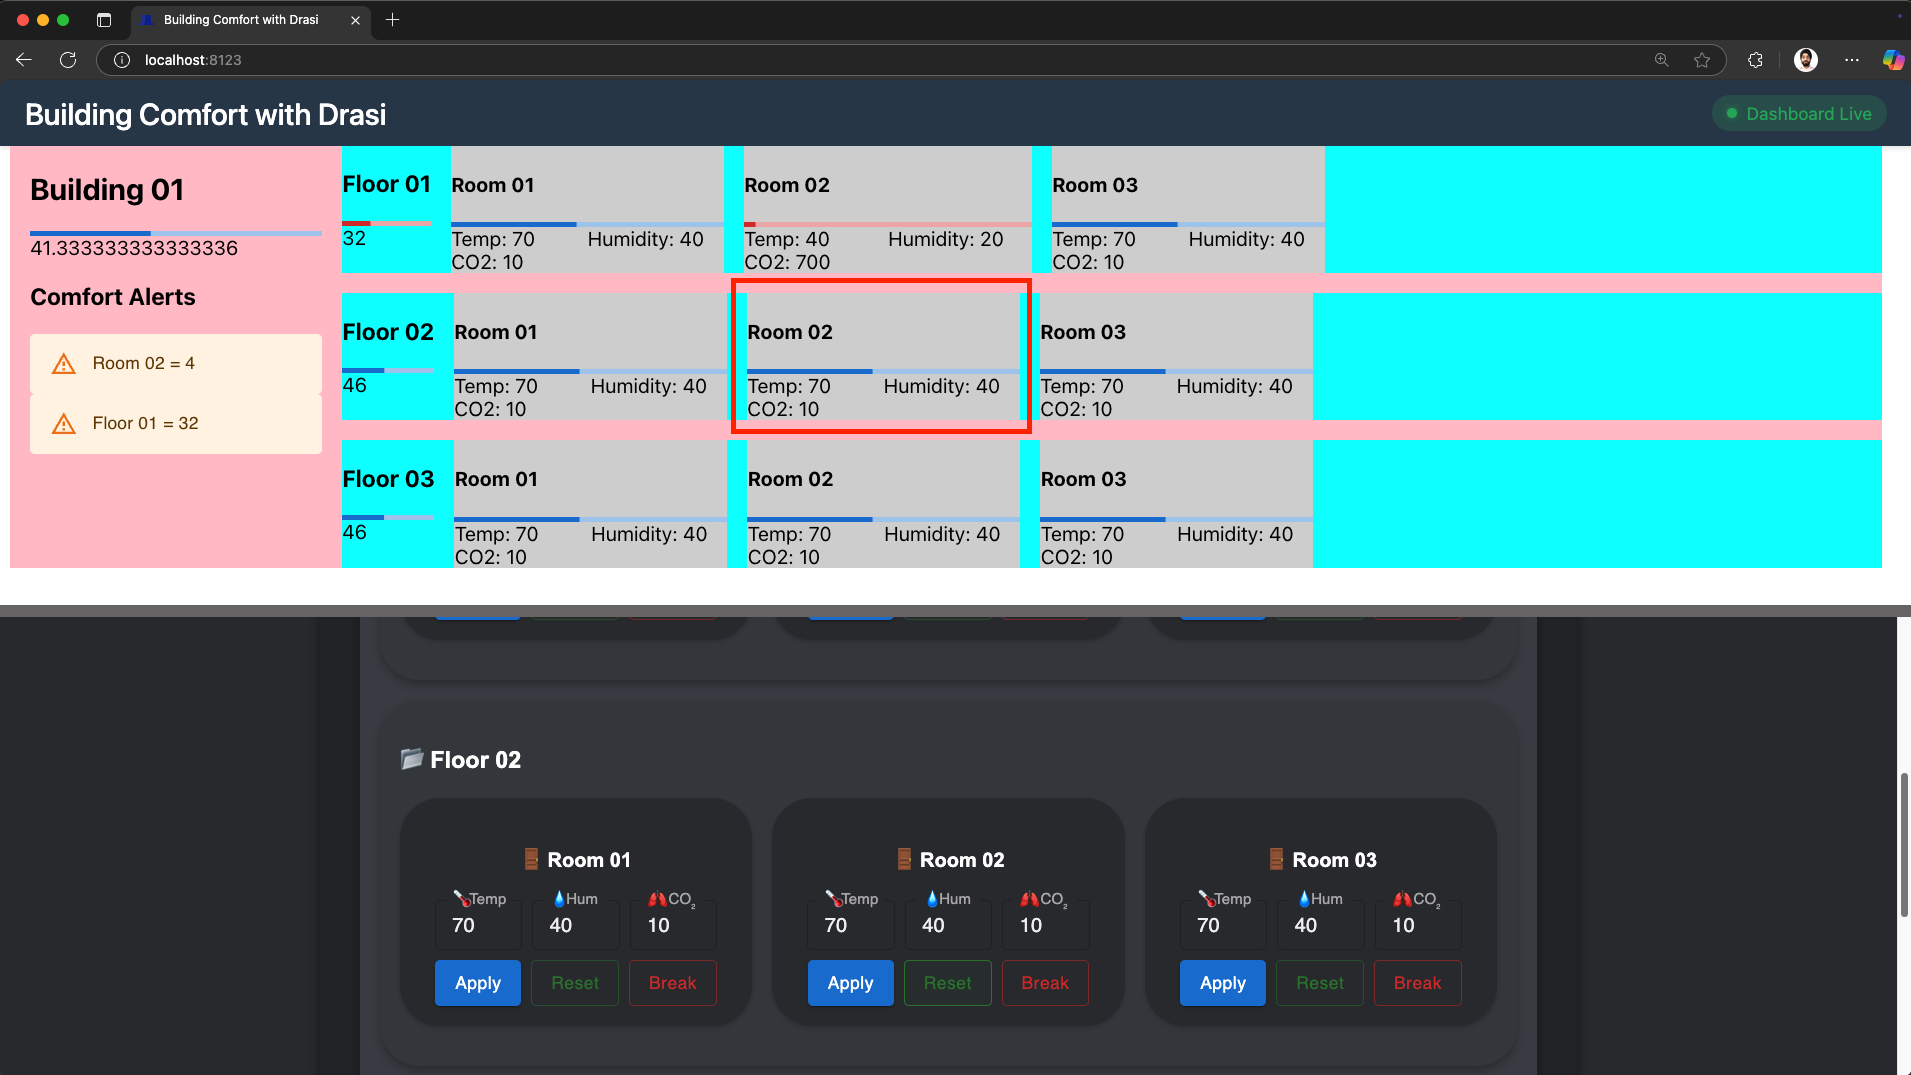
- Breaking a Room on another floor:
- Next scroll down in the Control Panel to find the controls for
Building 01→Floor 02→Room 02. - Click the “Break” button for Room 02 for Floor 02 as shown in screenshot below.
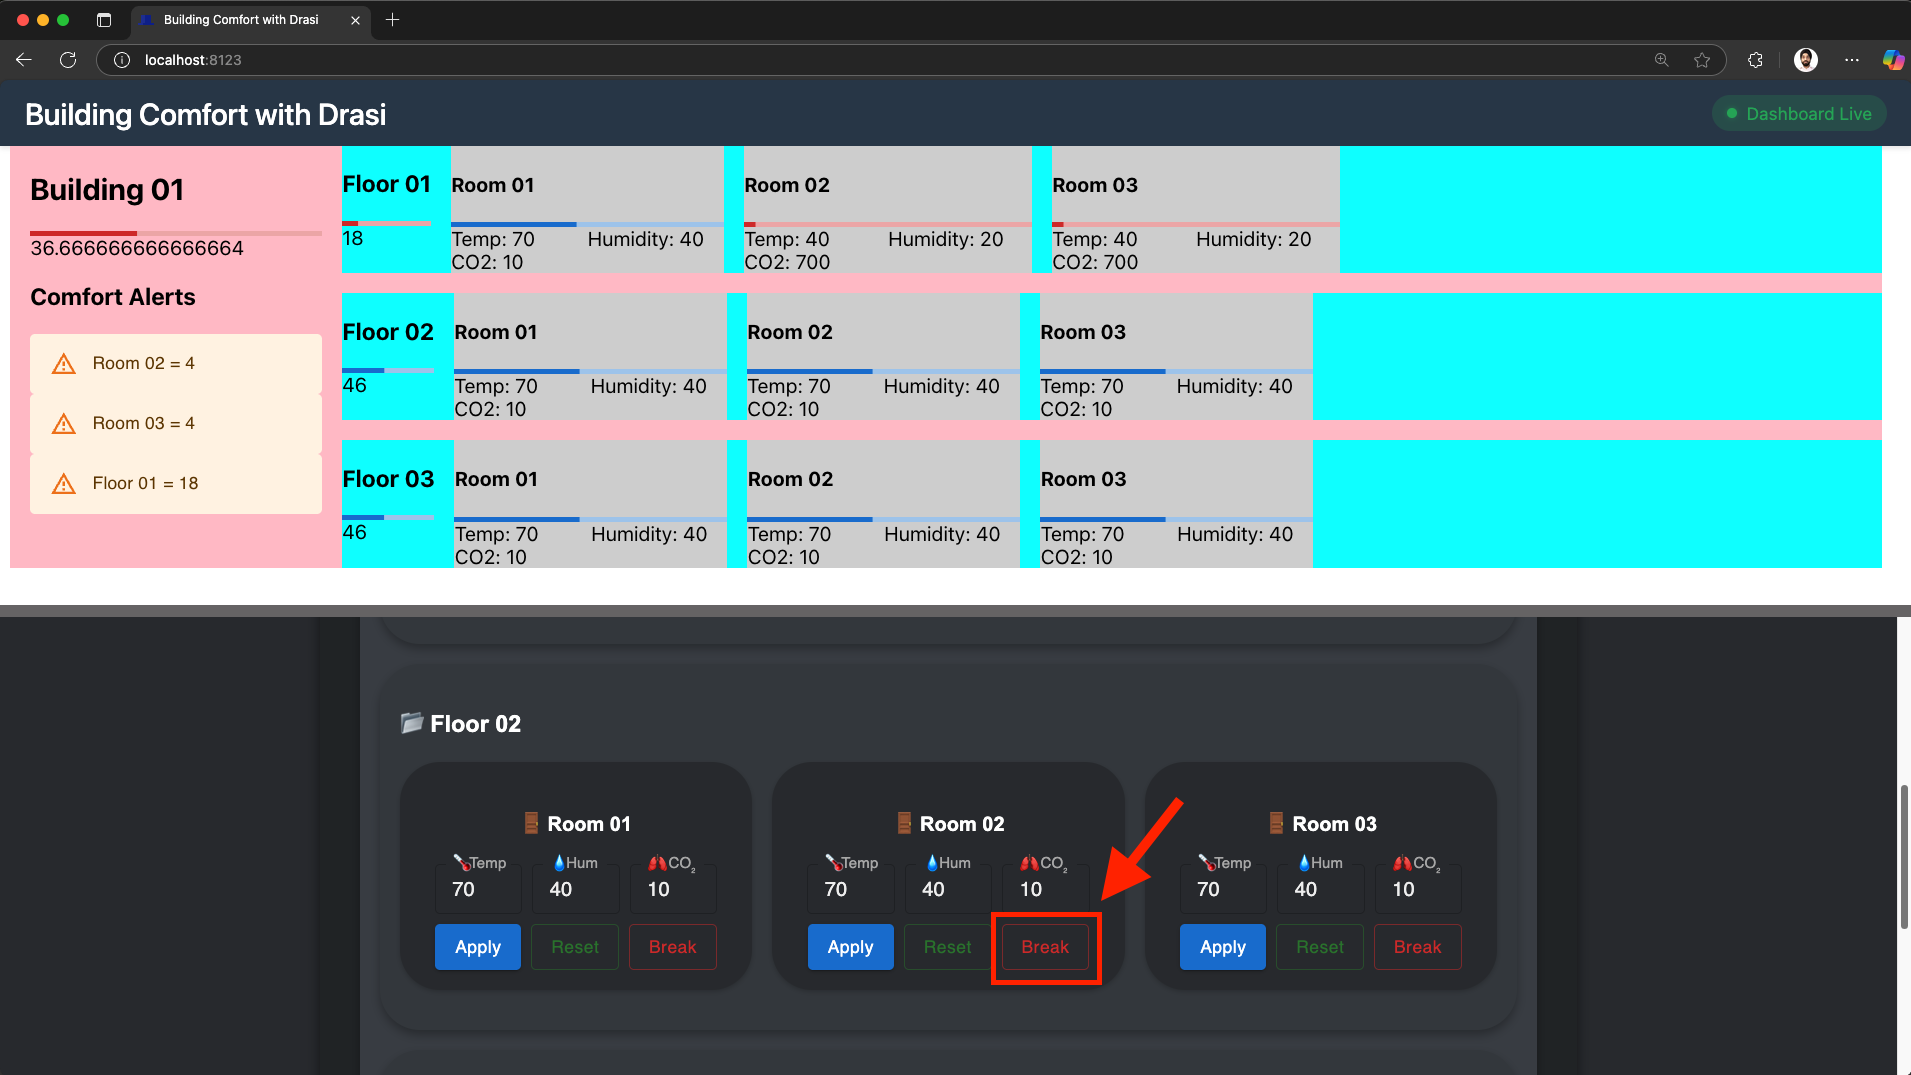
- Within a couple of seconds, we see that the dashboard indicator for
Room 02inFloor 01turns red. - As the screenshot below shows, the average comfort level of
Floor 02drops andBuilding 01also drops further to32. - In the (yellow) Alerts section on the left, we see an additional alerts for
Room 02andFloor 02.
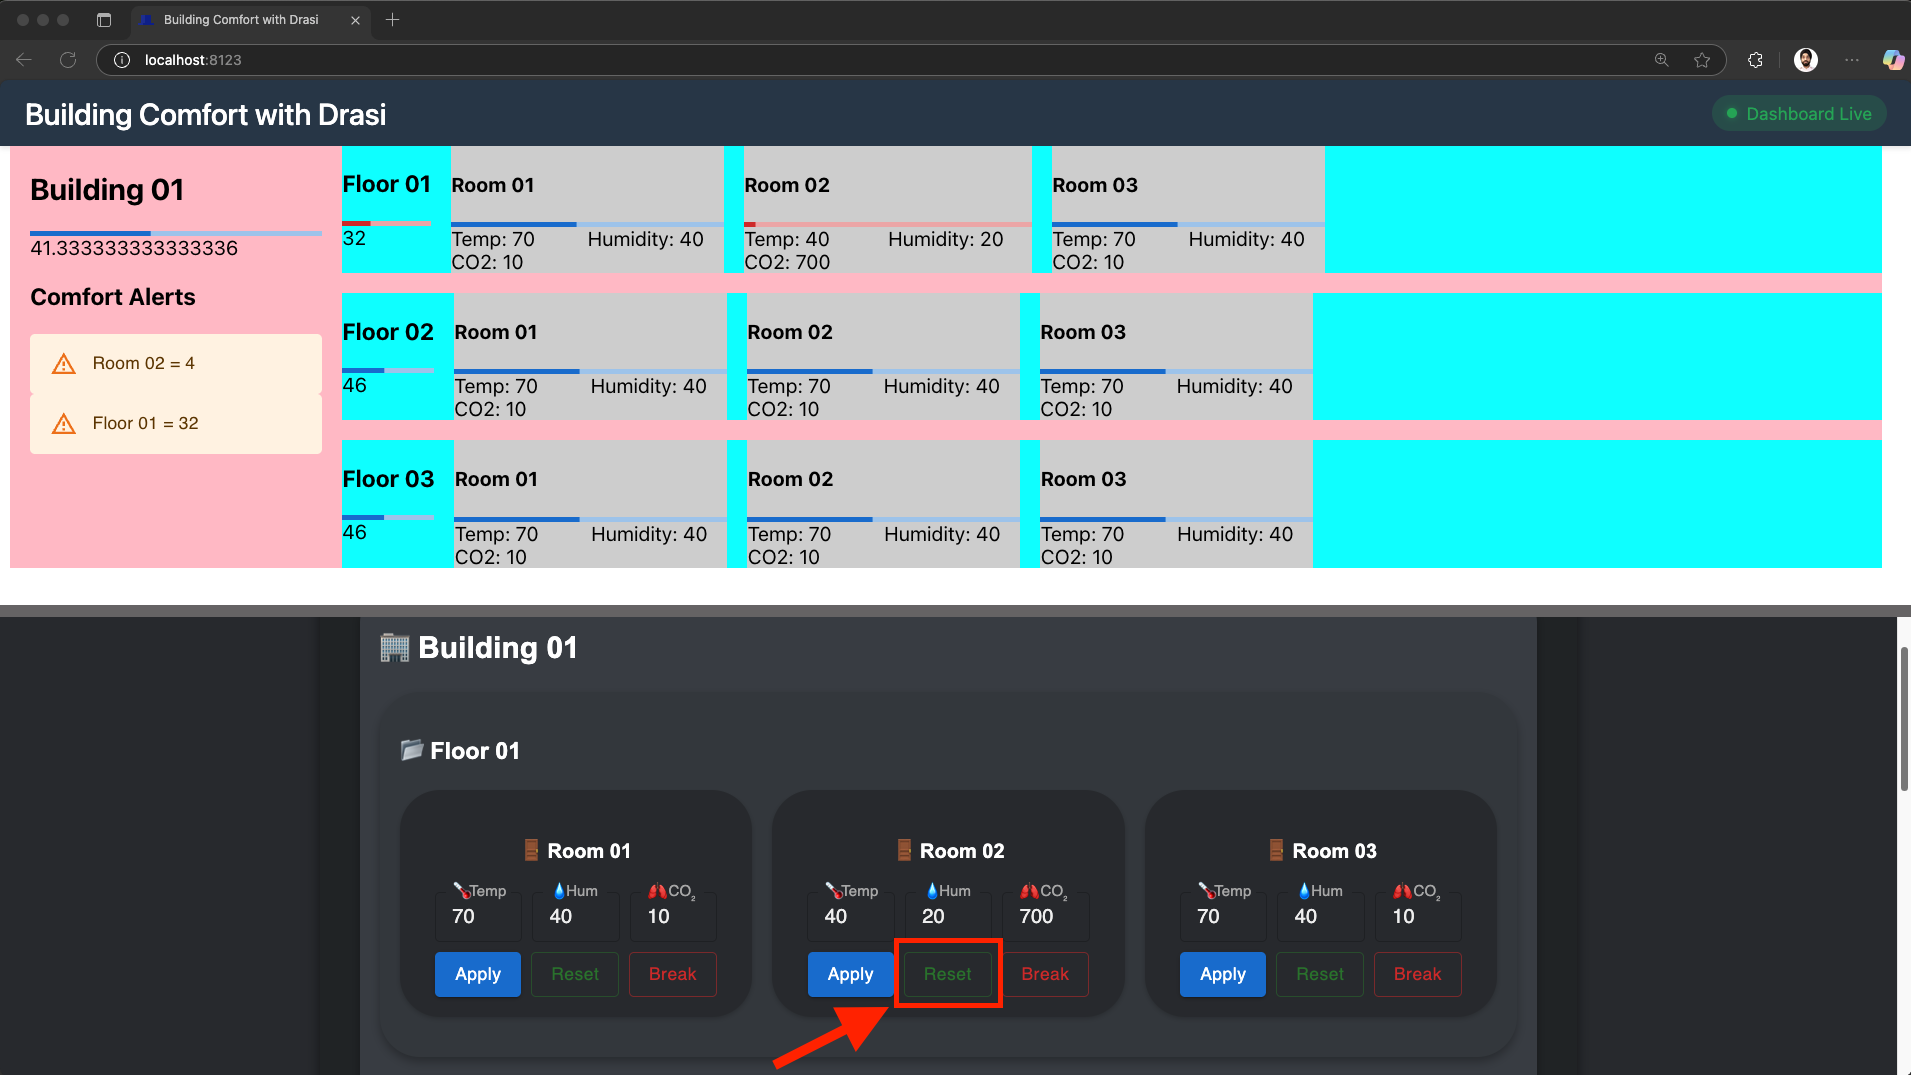
- Reset a Room:
- In the Control-Panel, let’s click the Reset button for
Floor 01andRoom 03as shown in screenshot below:
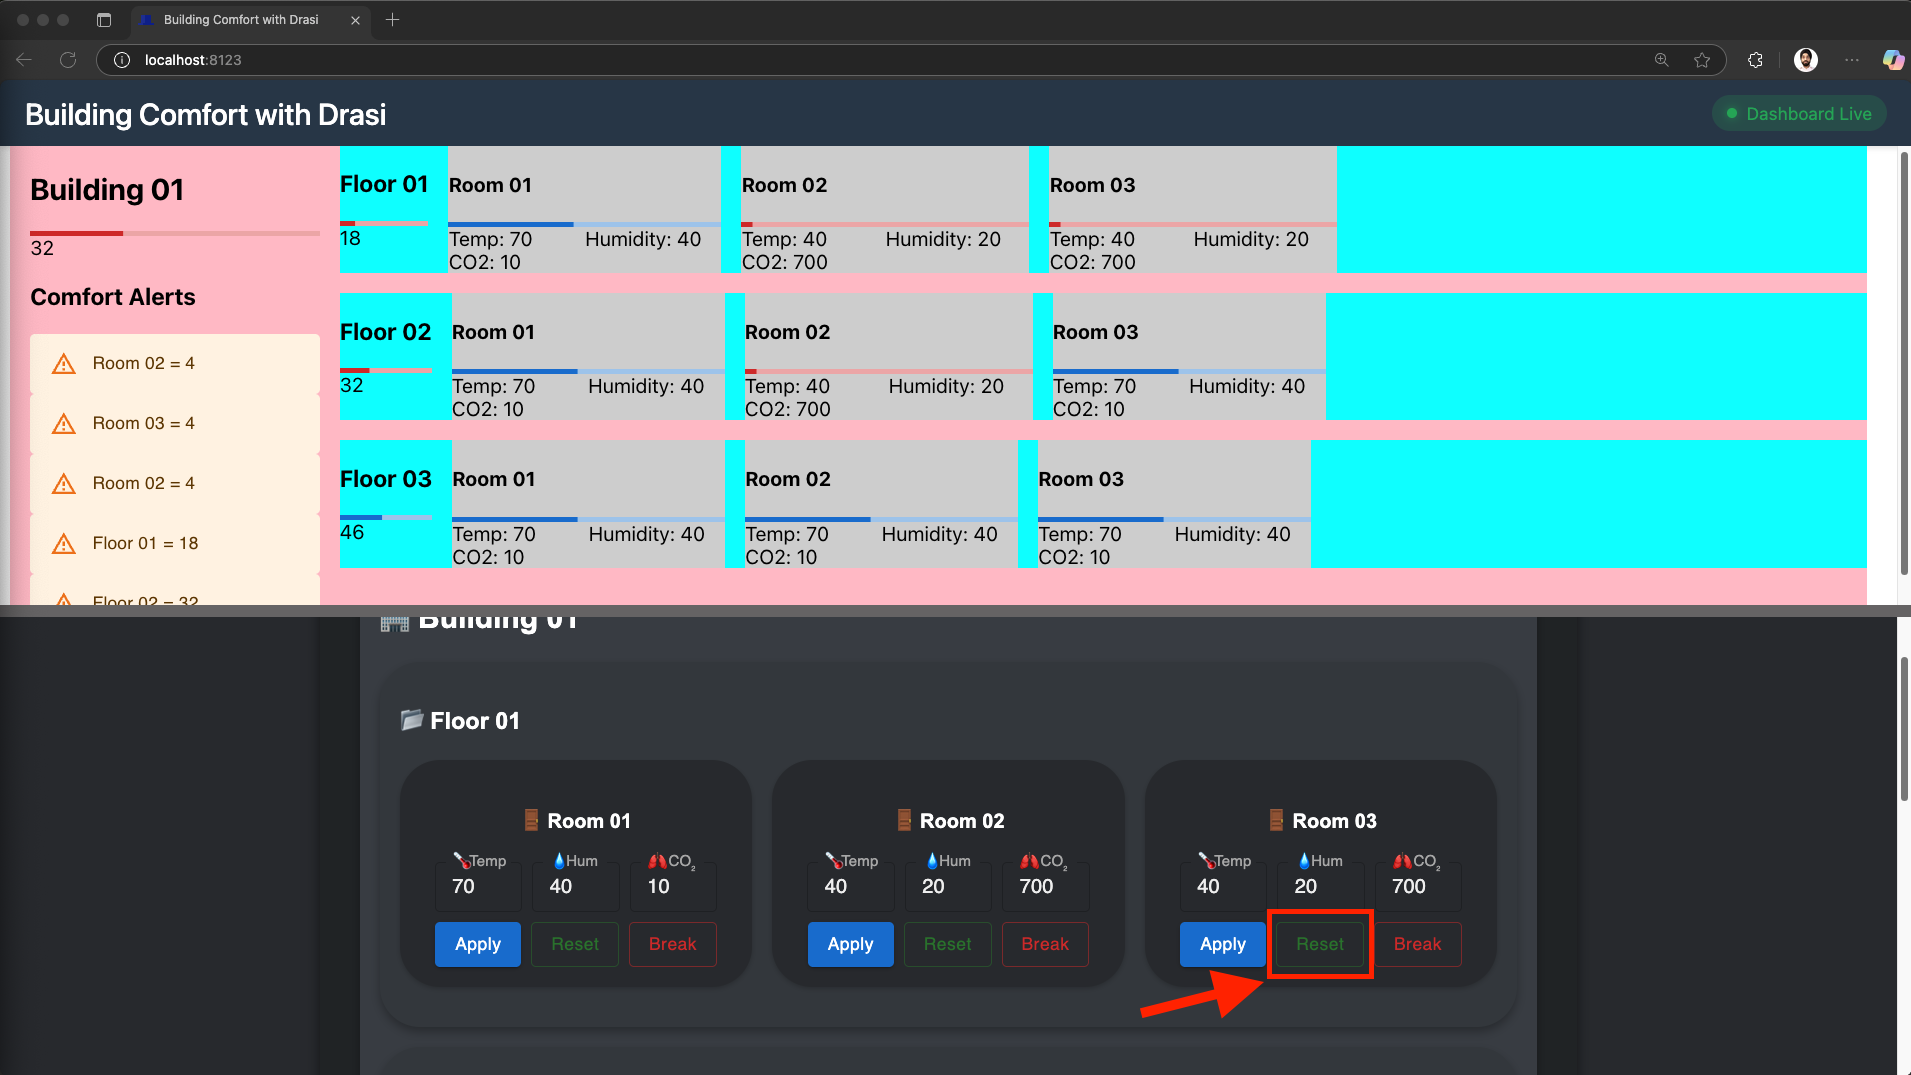
- Within a couple of seconds we see that alerts for this room are gone.
- As shown in screenshot below, the room’s indicator is no longer red.
- Reset another Room:
- Scroll down in the Control-Panel to find the Reset button for
Floor 02andRoom 02as shown in screenshot below, and click it:
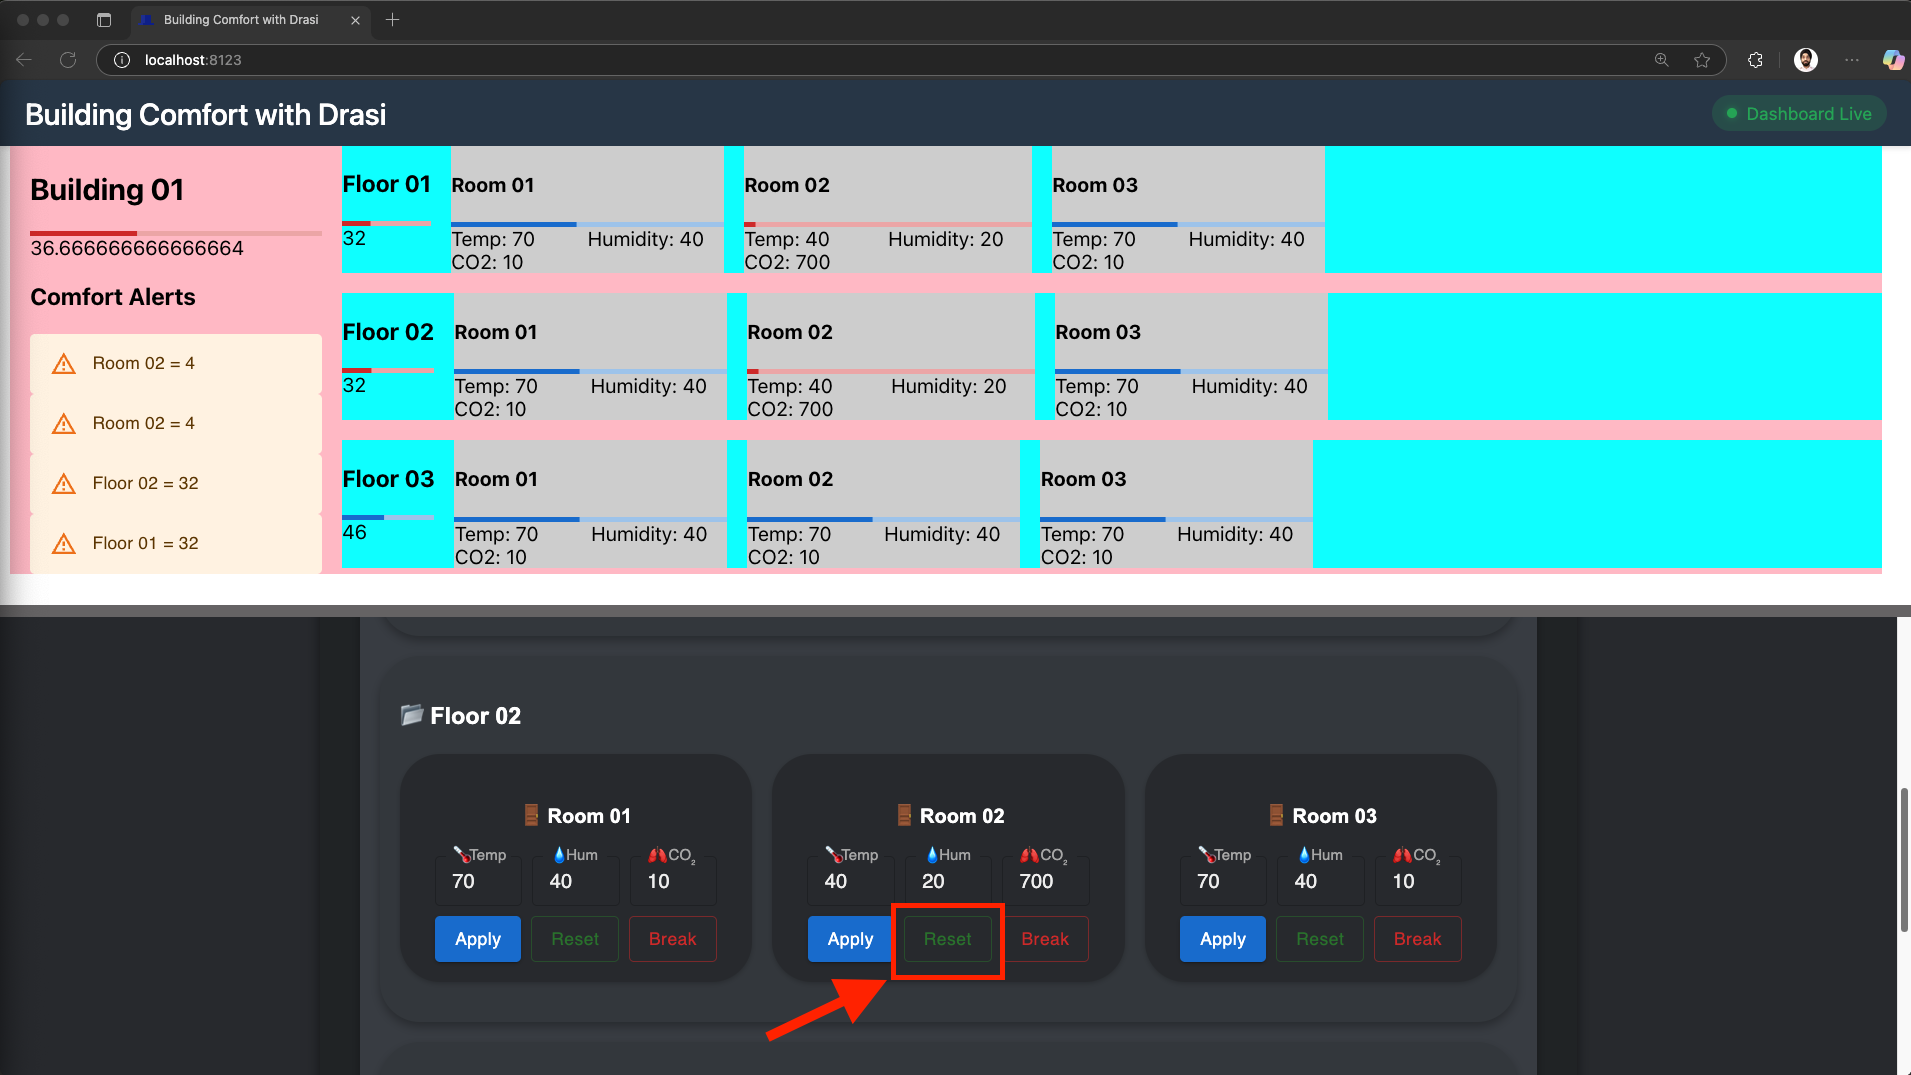
- Within a couple of seconds we see that alerts for this
Room 02onFloor 02are gone. - As shown in screenshot below, the room’s indicator is no longer red.
- Reset remaining room:
- In the Control-Panel, find the Reset button for
Floor 02andRoom 02and click on it as shown in screenshot below:
- Within a couple of seconds we see that alerts for this
Room 02onFloor 01are also gone. - As shown in screenshot below, the room’s indicator is no longer red.
- All the alerts are also gone now.
Feel free to explore more by adjusting individual sensors for various rooms on the control panel:
- Use the sliders to change temperature, humidity, or CO2
- See real-time comfort level calculations
- Watch as rooms, floors, and buildings change colors based on average comfort
- Observe how changes propagate up the hierarchy
As you can see our new dashboard updates instantly as you make changes, demonstrating Drasi’s ability to:
- Detect changes in the PostgreSQL database
- Calculate complex metrics using Cypher queries
- Push updates in real-time via SignalR
Reflection
Congratulations! You were able to build a reactive dashboard UI for the building management scenario using Drasi. Let’s reflect on the journey we’ve been on.
Work with existing systems
We did not need to make any changes to the existing system we had setup with
sensors and the data store (Postgres). We were able to add the existing
Postgres instance as a Source in Drasi which opened the system to queries.
This source was created using a YAML file which simply describes the
connection parameters of the datastore.
Synthetic Relationships in Drasi also helped us express the hierarchy between Rooms, Floors and Buildings.
No Code
Adding the source in Drasi opened up the world of Continuous Queries. We were
able to write the queries for Comfort Level in a declarative Cypher query
without worrying about implementation. Using declarative Cypher query, we
could intuitively express the business logic of the changes we wanted to
monitor.
Drasi can represent one or more existing data sources as Graphs which can be linked together using Synthetic Relationships.
Reactiveness
With the SignalR hub giving us data about Buildings, Floors and Rooms, the dashboard almost instantly reflects any changes to the measurements. If we fiddle with the Control Panel to mock changes in sensor measurements, we can see clearly that the dashboard reacts to it in near real time.
Summary
With this hypothetical scenario we are able to see how Drasi can help us build reactive systems out of existing systems. Learn more about "Why Drasi?" here.
Cleanup
Simply close the codespace window - No cleanup required. You may choose to delete your codespace to avoid additional billed usage.
Simply close your devcontainer and clean it up using the VS Code extension. Or, you can delete the docker container from Docker Desktop.
To clean up the tutorial, you can run the following scripts at the path tutorial/building-comfort:
macOS/Linux:
./scripts/cleanup-tutorial.sh
Windows (PowerShell):
.\scripts\cleanup-tutorial.ps1
This will give you options to:
- Delete tutorial resources (apps, database)
- Uninstall Drasi (optional)
- Delete the k3d cluster (optional)
What’s next?
You can try the next guided tutorial in our series that demonstrates additional capabilities of Drasi - multiple data sources & reacting to non-events. The Curbside Pickup tutorial will guide you using a scenario of Curbside Pickup management for a Store.
Here are some additional resources:
- Learn more about Drasi sources here.
- Learn more about Continuous queries here.
- Learn more about Drasi Reactions here.
Appendix: Database Client
If you want to look at the PostgreSQL database, you may use psql for your local setup. For codespaces and devcontainers, we have included a DB Client extension:
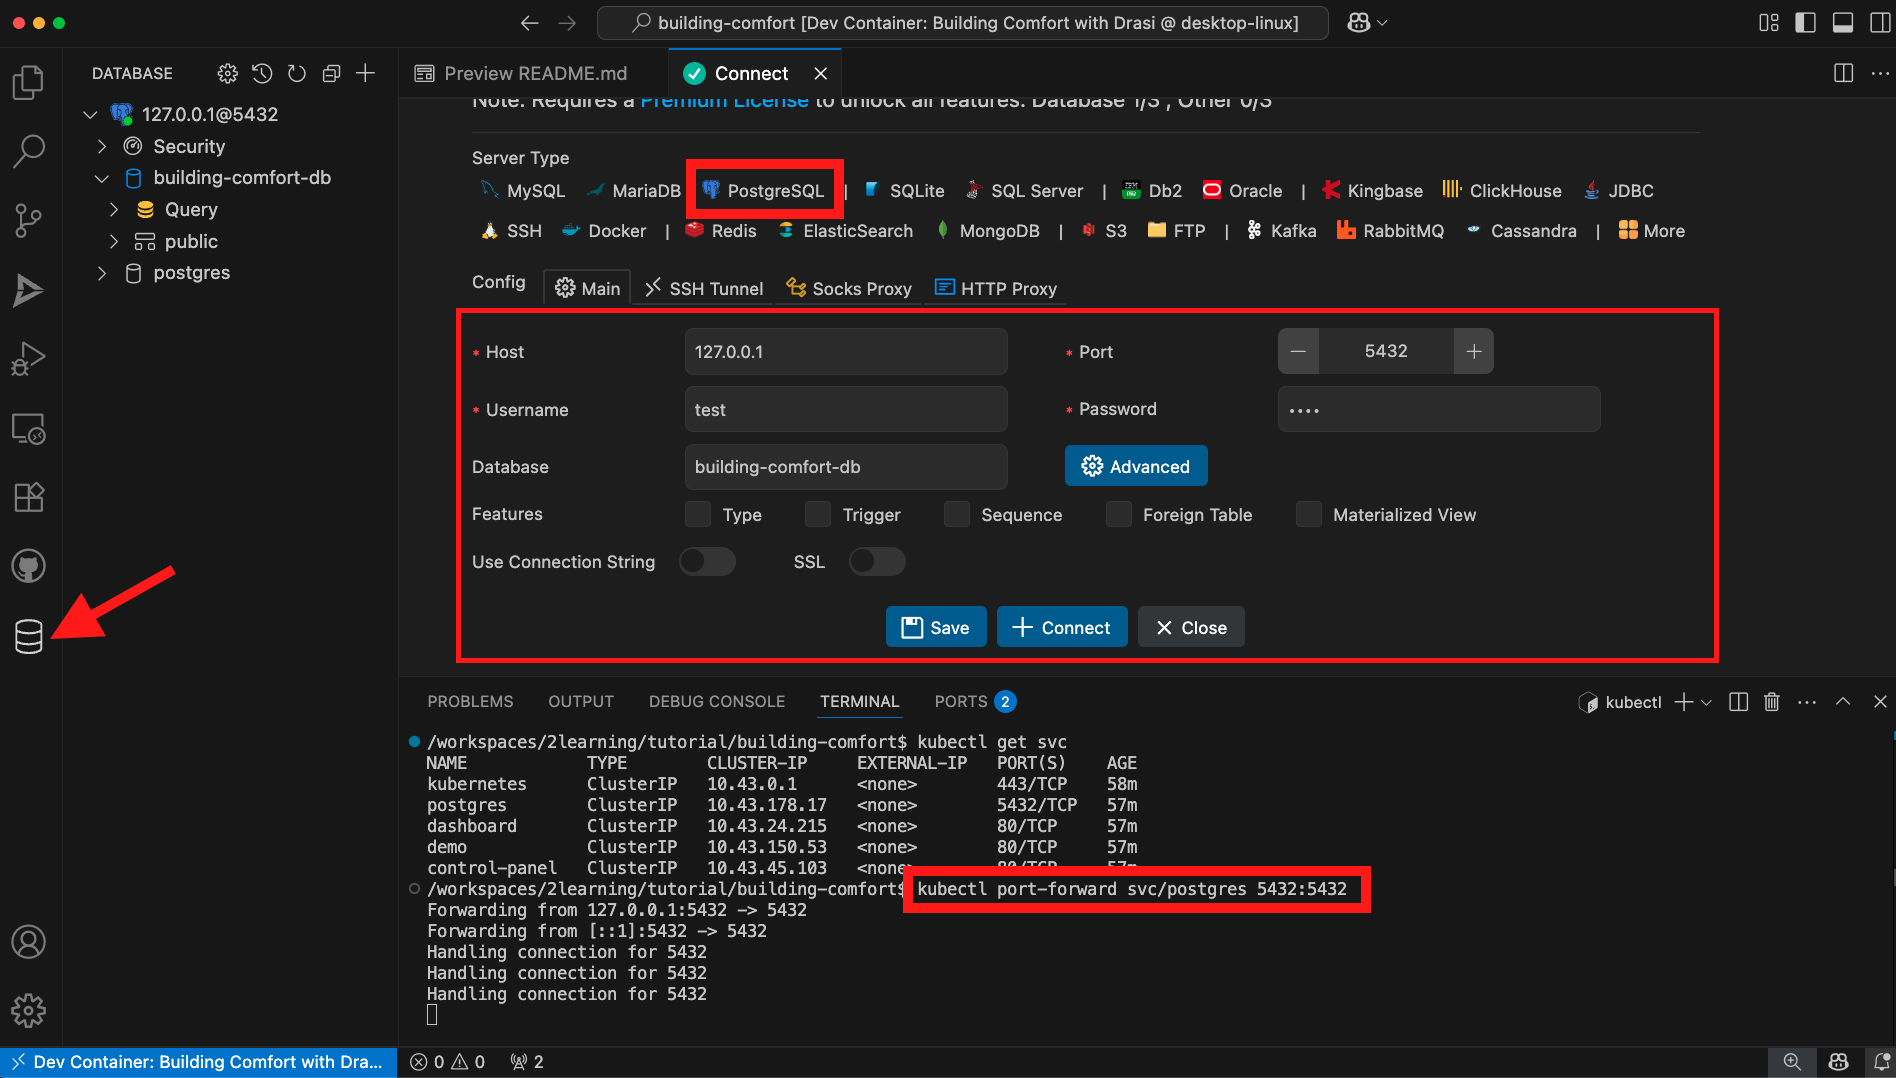
Note: For this to work, you must run a port-forward on the postgres service running on k3d.
Appendix: Additional Scripts
If you want to modify the applications, the tutorial includes helpful scripts:
Hot Reload for Development
macOS/Linux:
# Rebuild and deploy the control panel with your changes
cd tutorial/building-comfort
./scripts/dev-reload.sh control-panel
Windows (PowerShell):
cd tutorial\building-comfort
.\scripts\dev-reload.ps1 control-panel
This script:
- Builds a new Docker image from local source
- Imports it into the k3d cluster
- Updates the deployment to use your custom image
Reset to Official Images
macOS/Linux:
# Reset a single app
./scripts/reset-images.sh control-panel

# Reset all apps
./scripts/reset-images.sh all
Windows (PowerShell):
# Reset a single app
.\scripts\reset-images.ps1 control-panel

# Reset all apps
.\scripts\reset-images.ps1 all
Feedback
Was this page helpful?
Glad to hear it! Please tell us what you found helpful.
Sorry to hear that. Please tell us how we can improve.