Curbside Pickup with Drasi
35 minute read
Scenario
Imagine a hypothetical scenario where a store is operating curbside pickup for customer orders.
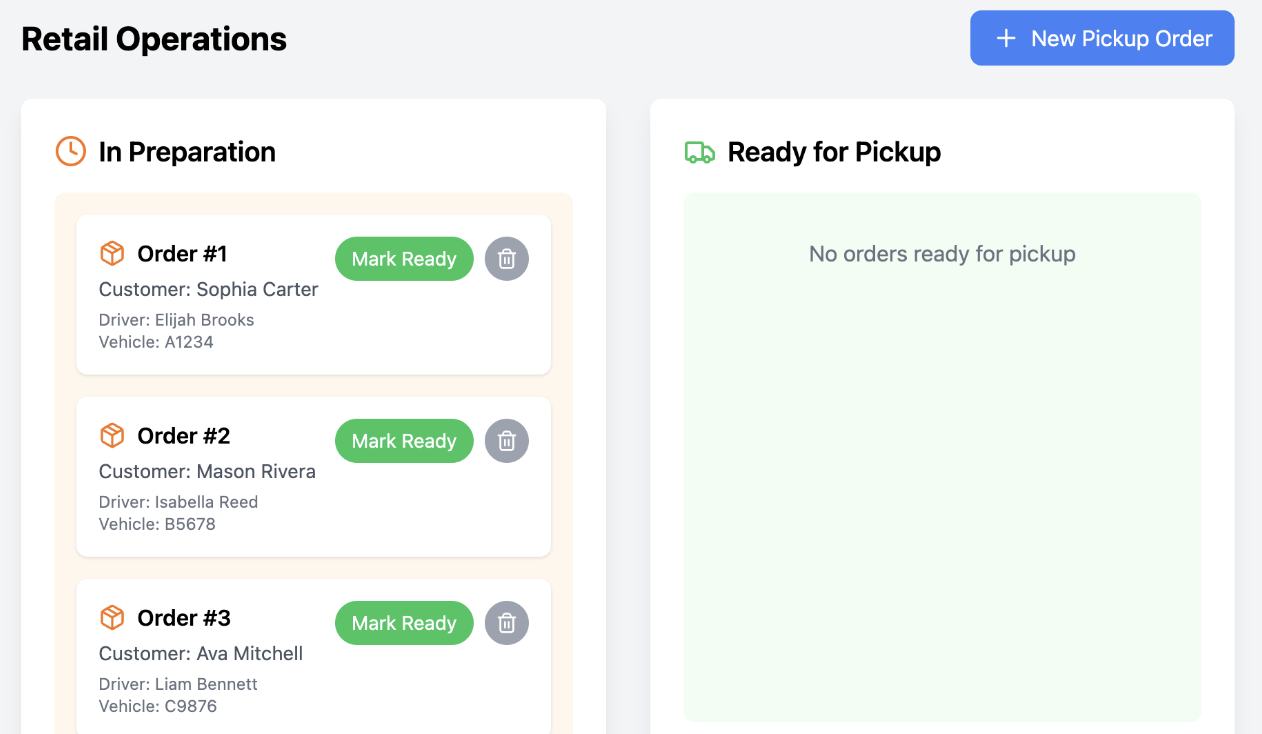
Retail Operations
The order information is stored in a PostgreSQL database and it includes:
- Customer Name
- Driver Name
- Pickup Vehicle Plate
- Order Status
When the retail team is ready with an order, they can mark the Order status as “Ready”. The PostgreSQL database reflects the realtime state of orders.
We can simulate the functioning of the retail team of the store using a Retail-Operations app like this:
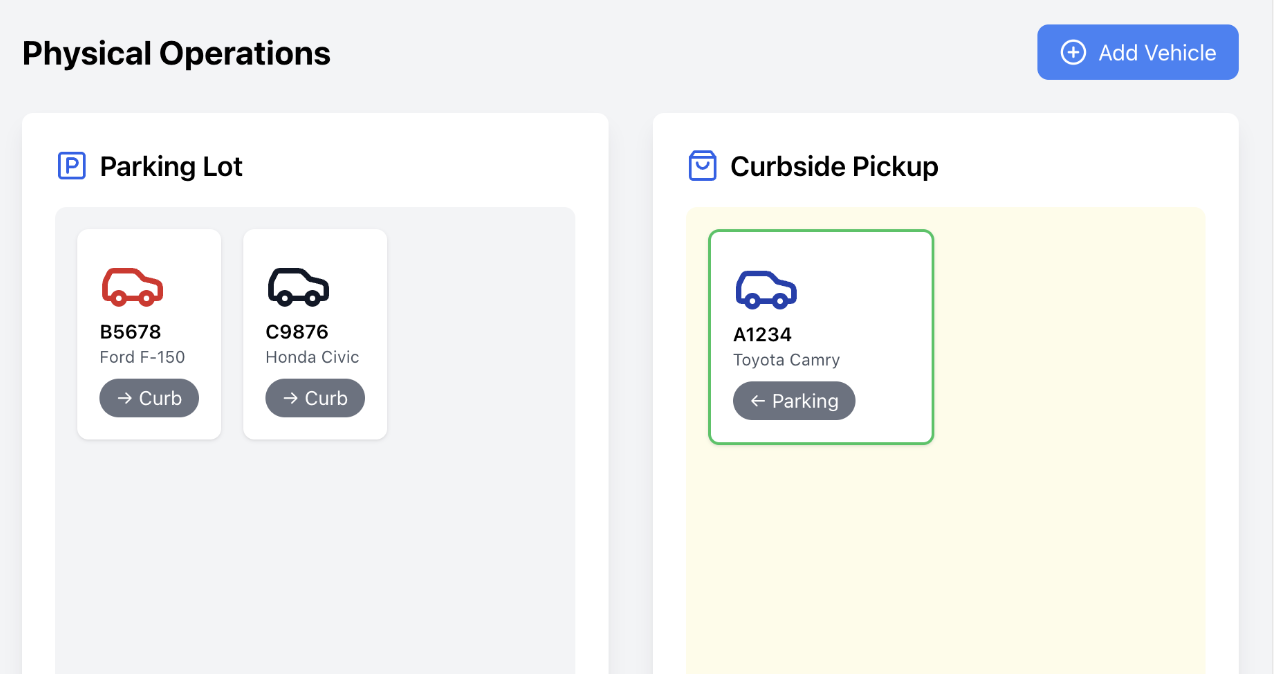
Physical Operations
An independent MySQL database stores information about vehicles arriving at the store in real time. When the drivers get assigned to an order, they register the following details, which gets added to the database.
- Pickup Vehicle Plate
- Vehicle Make
- Vehicle Model
- Vehicle Color
- Vehicle Location
When the driver moves to the “Curbside Pickup” zone, they update their “Location” to “Curbside”. The MySQL database reflects the realtime state of the vehicles.
We can also imagine a delivery staff that takes the orders that are marked as “Ready” to their drivers when they are at the pickup zone on the curbside.
We can simulate movement of pickup vehicles using a Physical-Operations app like this:
Order Delivery
Let us say we want to build a reactive front end dashboard that would alert the delivery staff when an order is ready and is matched to a driver who has arrived at the curbside pickup zone. The dashboard should get dynamically updated as the vehicle location changes or when the order status changes.
What would it take to build such a reactive dashboard that has incoming data from two different databases?
Delayed Orders
What if we also wanted a dashboard that can alert the retail backend team when the pickup driver has been waiting in the curbside zone and the order has not been ready for more than a fixed amount of time?
How would we build such a dashboard? Is it even possible to build such a dashboard if the Vehicle database does not save the time of location update?
Traditional Approaches
Regardless of the approach we take, the front-end component of the dashboard can be a single-page application built using React, Vue, Angular, etc and it needs realtime updates which can be achieved in one of three ways:
- Web Sockets
- Server Sent Events
- Long polling
We would also need a backend that powers such subscriptions for the front-end. This could be handled by Sockets.IO, Pusher or a hub-based backend like SignalR.
But how do we generate the realtime notifications for both dashboards? We can explore two different approaches for that below.
Polling for changes
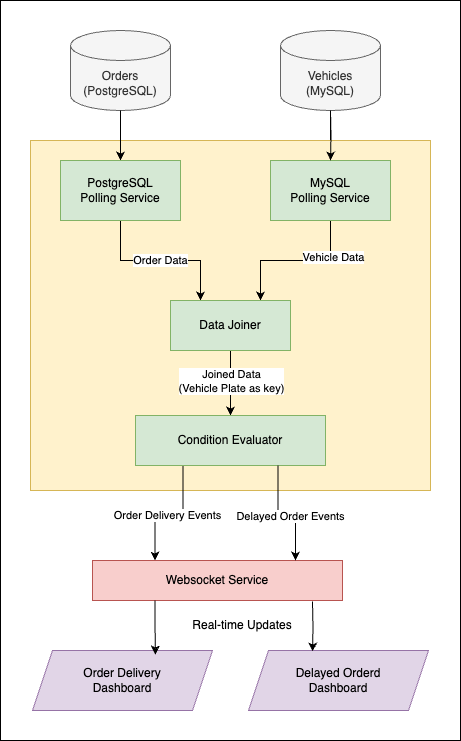
In this approach, a dashboard application periodically queries both databases, joins the data in the application layer, and evaluates the conditions for each dashboard.
-
Components
-
Backend Application:
- Polls the PostgreSQL database for order data (e.g., every 10 seconds).
- Polls the MySQL database for vehicle data (e.g., every 10 seconds).
- Joins the datasets in memory using the Pickup Vehicle Plate as the key.
- Evaluates conditions and generates alerts.
-
Frontend Dashboard:
- Web application that queries the backend via API or receives updates via polling/websockets.
- Displays alerts to delivery staff and retail backend team.
-
Order Delivery Dashboard Logic
- Query PostgreSQL for orders where Order Status = ‘Ready’.
- Query MySQL for vehicles where Location = ‘Curbside’.
- Match records by Pickup Vehicle Plate.
- Send matched pairs as alerts to the delivery staff dashboard.
-
Delayed Orders Dashboard Logic
- Query MySQL for vehicles where Location = ‘Curbside’.
- For each vehicle, retrieve the corresponding order from PostgreSQL.
- Check the timestamp of the location update (assuming MySQL records when Location changes to “Curbside”).
- Calculate waiting time (current time - arrival timestamp).
- If waiting time exceeds the threshold (e.g., 5 minutes) and Order Status ≠ “Ready”, send an alert to the retail backend dashboard.
-
-
Assumptions
- The MySQL database includes a timestamp for location updates to track arrival time at “Curbside”.
-
Pros
- Simplicity: Easy to implement with basic application logic and standard database queries.
- No Additional Infrastructure: Relies on existing databases and a simple web app.
-
Cons
- Inefficiency: Frequent polling increases database load, especially with short intervals.
- Latency: Long polling intervals (e.g., 30 seconds) may delay alerts, reducing real-time responsiveness.
- Scalability: Does not scale well with high order/vehicle volumes due to repeated queries.
- Timestamp Dependency: Requires the MySQL database to log location update timestamps, which may need schema changes if not already present.
Streaming Processing
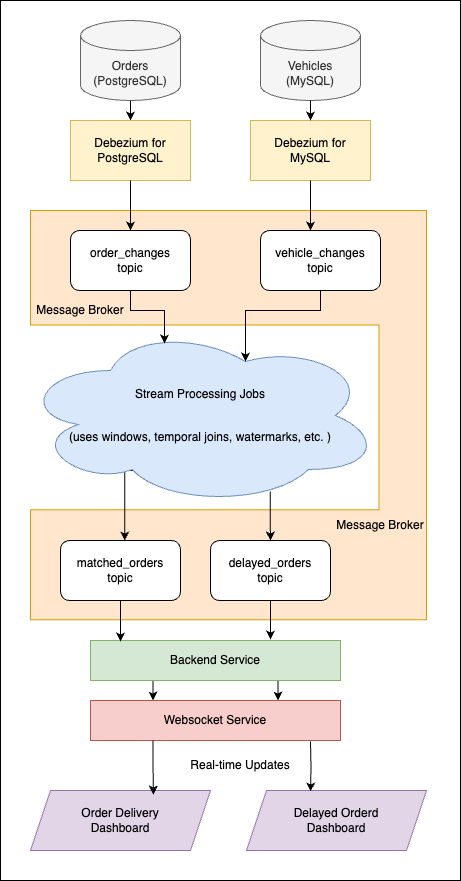
This approach leverages change data capture (CDC) to get real-time data streams from both databases into a message broker. These streams are then processed by a stream processing system, to detect conditions and push updates to the separate topics in the message broker. These topics are then consumed by a backend service which can push updates to a websocket service to power the dashboards.
-
Components
- Change Data Capture (CDC):
- PostgreSQL: Use Debezium to capture changes via logical decoding.
- MySQL: Use Debezium to capture changes via binlog streaming.
- Message Broker:
- Apache Kafka with following topics:
- order_changes: Streams order updates from PostgreSQL.
- vehicle_changes: Streams vehicle updates from MySQL.
- matched_orders: Stores the output for matched orders.
- delayed_orders: Stores output for delayed orders.
- Apache Kafka with following topics:
- Stream Processing:
- Need a stream processing engine like Flink.
- Must utilize concepts like Temporal Joins, Watermarks, Interval Joins, and Dynamic Tables in Flink (or equivalent in other engines).
- We explore how one would write a Flink SQL job for the delivery dashboard here.
- We explore how one would write a Flink SQL job for the delay dashboard here.
- Change Data Capture (CDC):
-
Assumptions
- MySQL and PostgreSQL support CDC (via tools like Debezium).
- The system can access current timestamps for vehicle location changes.
-
Pros
- Near Real-Time: Alerts are generated with minimal latency.
- Efficiency: Reduces database load by using CDC rather than polling.
- Scalability: Handles high data volumes with distributed streaming platforms like Kafka.
- Flexibility: Easily extends to additional conditions or dashboards.
-
Cons
- Requires setting up CDC, Kafka, and stream processing, which involves more components and expertise.
- Needs additional systems (Kafka, stream processor), increasing deployment overhead.
- Need to consider event schemas for output topics.
- Need additional backend service that consumes output of topic and updates dashboards.
Delivery Dashboard with Flink
A big overhead is also writing complicated Stream Processing jobs. With declarative mode of authoring queries like Flink SQL, the queries can be a bit easier for simpler scenarios like required by Delivery Dashboard:
-- Define the order_changes table (source from PostgreSQL via Debezium)
CREATE TABLE order_changes (
    order_id STRING,
    customer_name STRING,
    driver_name STRING,
    vehicle_plate STRING,
    status STRING,
    PRIMARY KEY (order_id) NOT ENFORCED
) WITH (
    'connector' = 'kafka',
    'topic' = 'order_changes',
    'properties.bootstrap.servers' = 'localhost:9092',
    'format' = 'debezium-json'
);

-- Define the vehicle_changes table (source from MySQL via Debezium)
CREATE TABLE vehicle_changes (
    vehicle_plate STRING,
    make STRING,
    model STRING,
    color STRING,
    location STRING,
    PRIMARY KEY (vehicle_plate) NOT ENFORCED
) WITH (
    'connector' = 'kafka',
    'topic' = 'vehicle_changes',
    'properties.bootstrap.servers' = 'localhost:9092',
    'format' = 'debezium-json'
);

-- Define the matched_orders table (sink to Kafka)
CREATE TABLE matched_orders (
    order_id STRING,
    customer_name STRING,
    driver_name STRING,
    vehicle_plate STRING,
    make STRING,
    model STRING,
    color STRING
) WITH (
    'connector' = 'kafka',
    'topic' = 'matched_orders',
    'properties.bootstrap.servers' = 'localhost:9092',
    'format' = 'changelog-json'
);

INSERT INTO matched_orders
SELECT
    o.order_id,
    o.customer_name,
    o.driver_name,
    o.vehicle_plate,
    v.make,
    v.model,
    v.color
FROM
    order_changes o
JOIN
    vehicle_changes v
ON
    o.vehicle_plate = v.vehicle_plate
WHERE
o.status = 'Ready' AND v.location = 'Curbside';- Connects to the
order_changesKafka topic, which streams CDC events from the PostgreSQL DB via Debezium. - Also connects to the
vehicle_changesKafka topic, which streams CDC events from the MySQL database via Debezium. - Tracks the latest state of each vehicle using
vehicle_plateas the primary key. - Define the output Kafka topic
matched_orders, where matched order and vehicle data will be sent. - Joins the
order_changesandvehicle_changestables on the vehicle_plate field, and filters for orders withstatus = 'Ready'and vehicles withlocation = 'Curbside'. - The
matched_orderstable is setup with format aschangelog-json. In Flink this means that inserts are emitted when a row satisfies the WHERE condition & deletes are emitted when a row no longer satisfies it.
Delay Dashboard with Flink
Far more complicated is the query to power a delay dashboard:
-- 1. Define the Orders Source Table (PostgreSQL CDC via Kafka)
CREATE TABLE orders (
  order_id STRING,
  pickup_vehicle_plate STRING,
  order_status STRING,
  event_time TIMESTAMP(3),
  WATERMARK FOR event_time AS event_time - INTERVAL '5' SECOND,
  PRIMARY KEY (pickup_vehicle_plate) NOT ENFORCED
) WITH (
  'connector' = 'kafka',
  'topic' = 'order_changes',
  'properties.bootstrap.servers' = 'localhost:9092',
  'format' = 'debezium-json',
  'scan.startup.mode' = 'earliest-offset'
);

-- 2. Define the Vehicles Source Table (MySQL CDC via Kafka)
CREATE TABLE vehicles (
  pickup_vehicle_plate STRING,
  vehicle_location STRING,
  event_time TIMESTAMP(3),
  WATERMARK FOR event_time AS event_time - INTERVAL '5' SECOND,
  PRIMARY KEY (pickup_vehicle_plate) NOT ENFORCED
) WITH (
  'connector' = 'kafka',
  'topic' = 'vehicle_changes',
  'properties.bootstrap.servers' = 'localhost:9092',
  'format' = 'debezium-json',
  'scan.startup.mode' = 'earliest-offset'
);

-- 3. Enrich Vehicle Events with Latest Order Status
CREATE VIEW enriched_vehicle_events AS
SELECT
  v.pickup_vehicle_plate,
  v.vehicle_location,
  o.order_status,
  v.event_time
FROM vehicles v
LEFT JOIN orders FOR SYSTEM_TIME AS OF v.event_time AS o
ON v.pickup_vehicle_plate = o.pickup_vehicle_plate;

-- 4. Enrich Order Events with Latest Vehicle Location
CREATE VIEW enriched_order_events AS
SELECT
  o.pickup_vehicle_plate,
  v.vehicle_location,
  o.order_status,
  o.event_time
FROM orders o
LEFT JOIN vehicles FOR SYSTEM_TIME AS OF o.event_time AS v
ON o.pickup_vehicle_plate = v.pickup_vehicle_plate;

-- 5. Combine All Enriched Events into a Single Stream
CREATE VIEW all_enriched_events AS
SELECT
  'vehicle' AS event_type,
  pickup_vehicle_plate,
  vehicle_location,
  order_status,
  event_time
FROM enriched_vehicle_events
UNION ALL
SELECT
  'order' AS event_type,
  pickup_vehicle_plate,
  vehicle_location,
  order_status,
  event_time
FROM enriched_order_events;

-- 6. Track Waiting State and Transitions
CREATE VIEW events_with_state AS
SELECT
  *,
  vehicle_location = 'Curbside' AND order_status != 'Ready' AS is_waiting,
  LAG(vehicle_location = 'Curbside' AND order_status != 'Ready', 1, FALSE)
    OVER (PARTITION BY pickup_vehicle_plate ORDER BY event_time) AS prev_is_waiting
FROM all_enriched_events;

-- 7. Identify Start Events (Waiting Begins)
CREATE VIEW start_events AS
SELECT
  pickup_vehicle_plate,
  event_time AS start_time
FROM events_with_state
WHERE is_waiting AND NOT prev_is_waiting;

-- 8. Identify End Events (Waiting Ends)
CREATE VIEW end_events AS
SELECT
  pickup_vehicle_plate,
  event_time AS end_time
FROM events_with_state
WHERE NOT is_waiting AND prev_is_waiting;

-- 9. Define the Output Sink Table
CREATE TABLE delayed_orders (
  op STRING,
  pickup_vehicle_plate STRING,
  time TIMESTAMP(3)
) WITH (
  'connector' = 'kafka',
  'topic' = 'delayed_orders',
  'properties.bootstrap.servers' = 'localhost:9092',
  'format' = 'json'
);

-- 10. Generate Insert and Delete Events
INSERT INTO delayed_orders
SELECT
  'insert' AS op,
  s.pickup_vehicle_plate,
  s.start_time AS time
FROM start_events s
LEFT OUTER JOIN end_events e
ON s.pickup_vehicle_plate = e.pickup_vehicle_plate
AND e.end_time > s.start_time
AND e.end_time <= s.start_time + INTERVAL '5' MINUTE
WHERE e.end_time IS NULL
UNION ALL
SELECT
  'delete' AS op,
  pickup_vehicle_plate,
  end_time AS time
FROM end_events;
One approach (as shown in the SQL above) could be like the following:
-
First, we read CDC events from Kafka with watermarks for event-time processing. The primary key pickup_vehicle_plate ensures Flink maintains the latest state per vehicle, assuming one active order per vehicle at a time.
-
Then temporal joins provide the current order status for vehicle events and vice versa, creating a stream where each event includes both
vehicle_locationandorder_status. -
The
events_with_stateview usesLAGto compare the current waiting condition (is_waiting) with the previous state, identifying start and end points. -
The interval left outer join checks if an end event occurs within 5 minutes of a start event. If no end event is found (e.end_time IS NULL), an ‘insert’ event is emitted when the watermark exceeds
start_time + 5minutes. An end event triggers a ‘delete’. -
The delayed_orders table outputs a changelog stream with op (‘insert’ or ‘delete’), pickup_vehicle_plate, and the relevant timestamp.
The output to the delayed_orders Kafka topic can then be used by the backend
service to add or remove drivers from the result set, which is then used to
keep the dashboards up to date by sending updates over websockets.
Enter Drasi
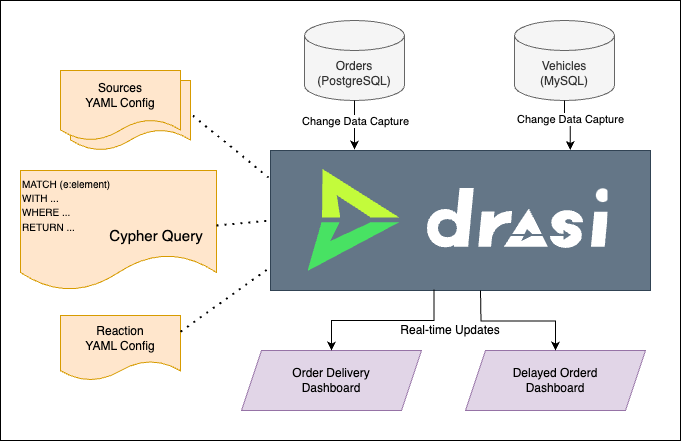
Drasi offers us a unique ability to declaratively write continuously running queries across a virtual knowledge graph that can span across multiple heterogeneous data sources. Drasi can also take action when the result sets of the queries change.
This means that we can simply add both the data sources in Drasi and write declarative queries on top and create a SignalR endpoint in minutes. Here is all we will need:
- YAML files for the 2 sources. These allow Drasi to subscribe to change-feeds.
- YAML file with declarative graph queries for the two scenarios.
- YAML file for configuring a SignalR endpoint.
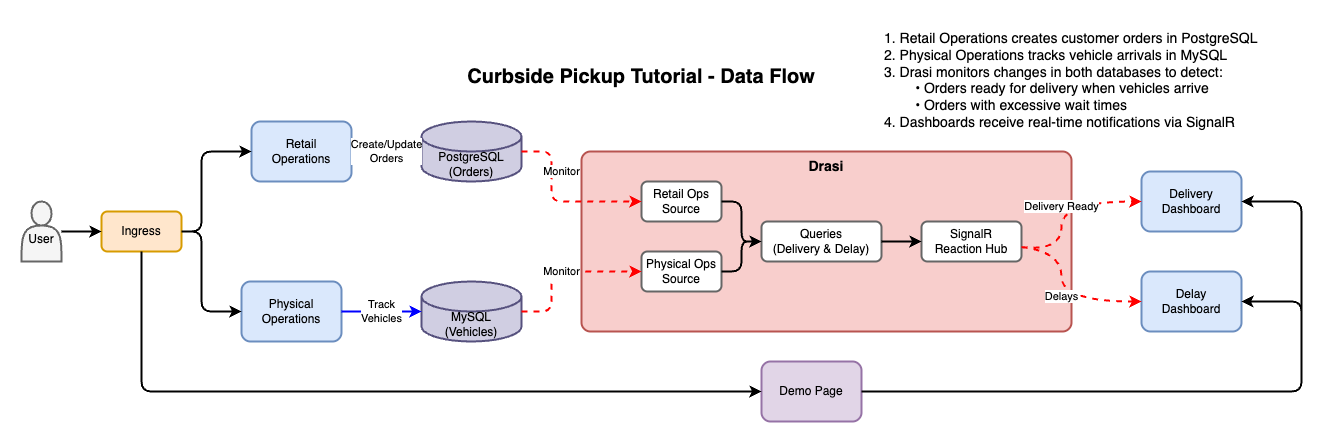
Here is how the architecture will look like with Drasi:
Curbside Pickup with Drasi
The rest of this tutorial will guide us step by step in setting up the mock scenario discussed earlier and create the two realtime dashboards with minimal effort.
Tutorial Modes
You can follow along the steps below in a Github codespace, a VSCode Dev Container or on a local k3d cluster on your machine.
The easiest way to follow along with this tutorial is to launch a Github Codespace using the link below. This will allow you to run the example application within your browser without setting up anything on your own machines.
![]()
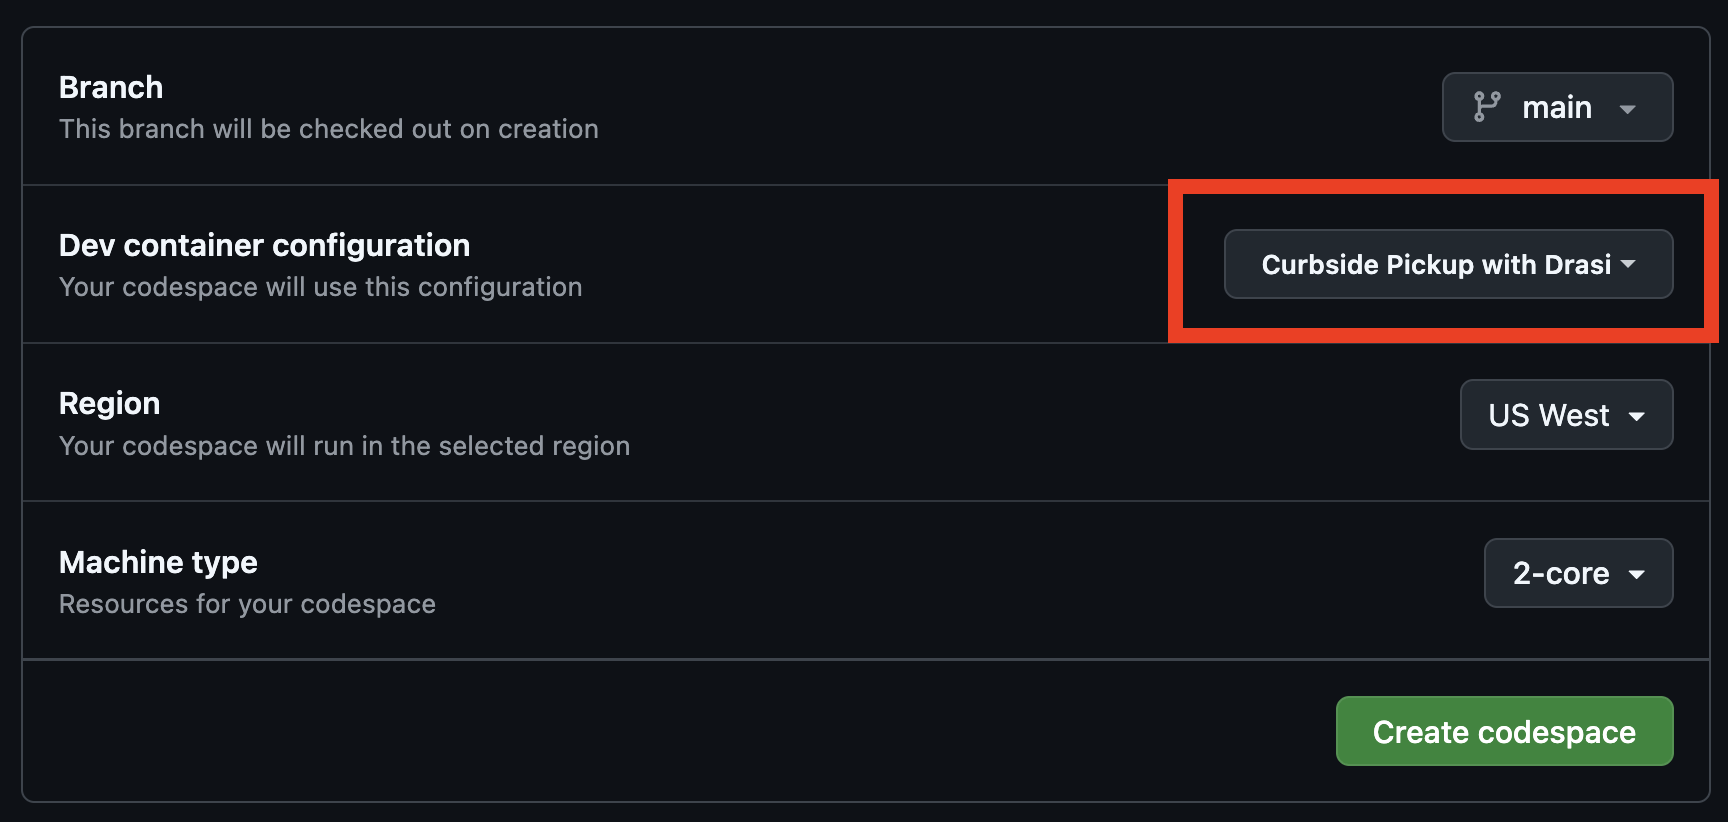
This will open a page with some configuration options. Make sure that the
‘Branch’ selected is main and set the ‘Dev Container configuration’ to
‘Curbside Pickup with Drasi’.
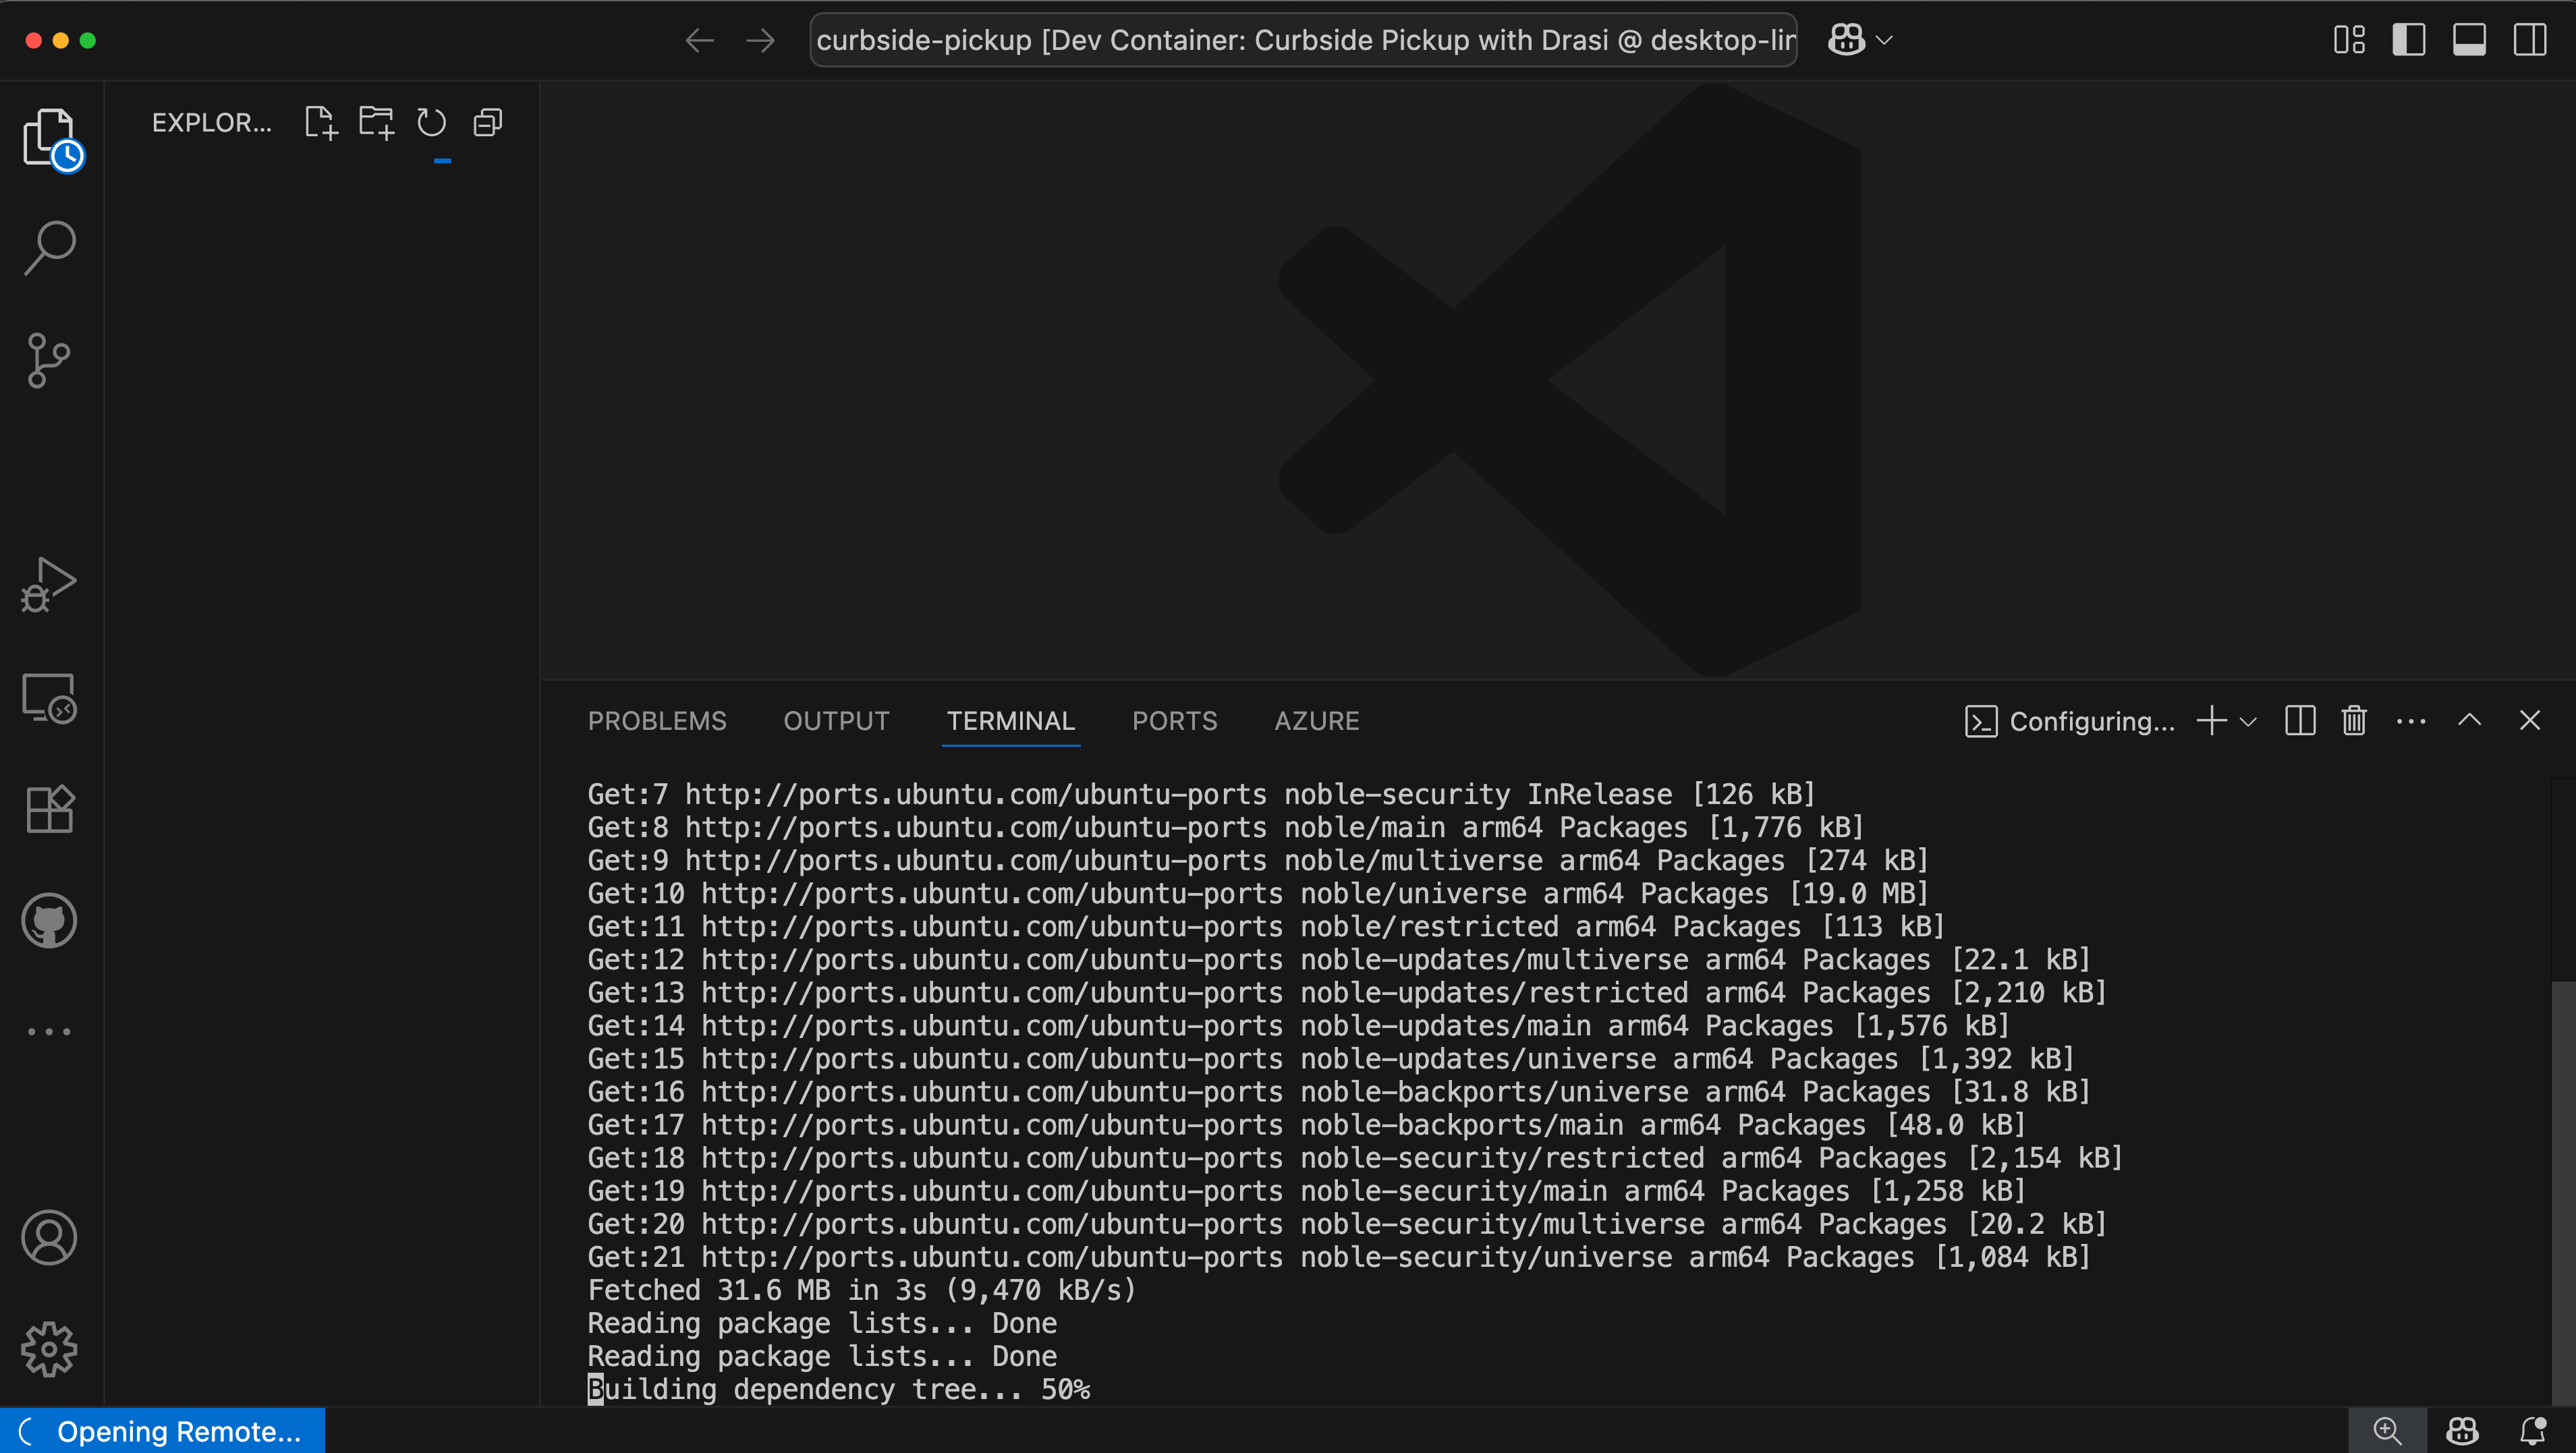
Note: The codespace will launch and run some setup scripts. Please wait for the scripts to complete. This should take less than 5 minutes to complete.
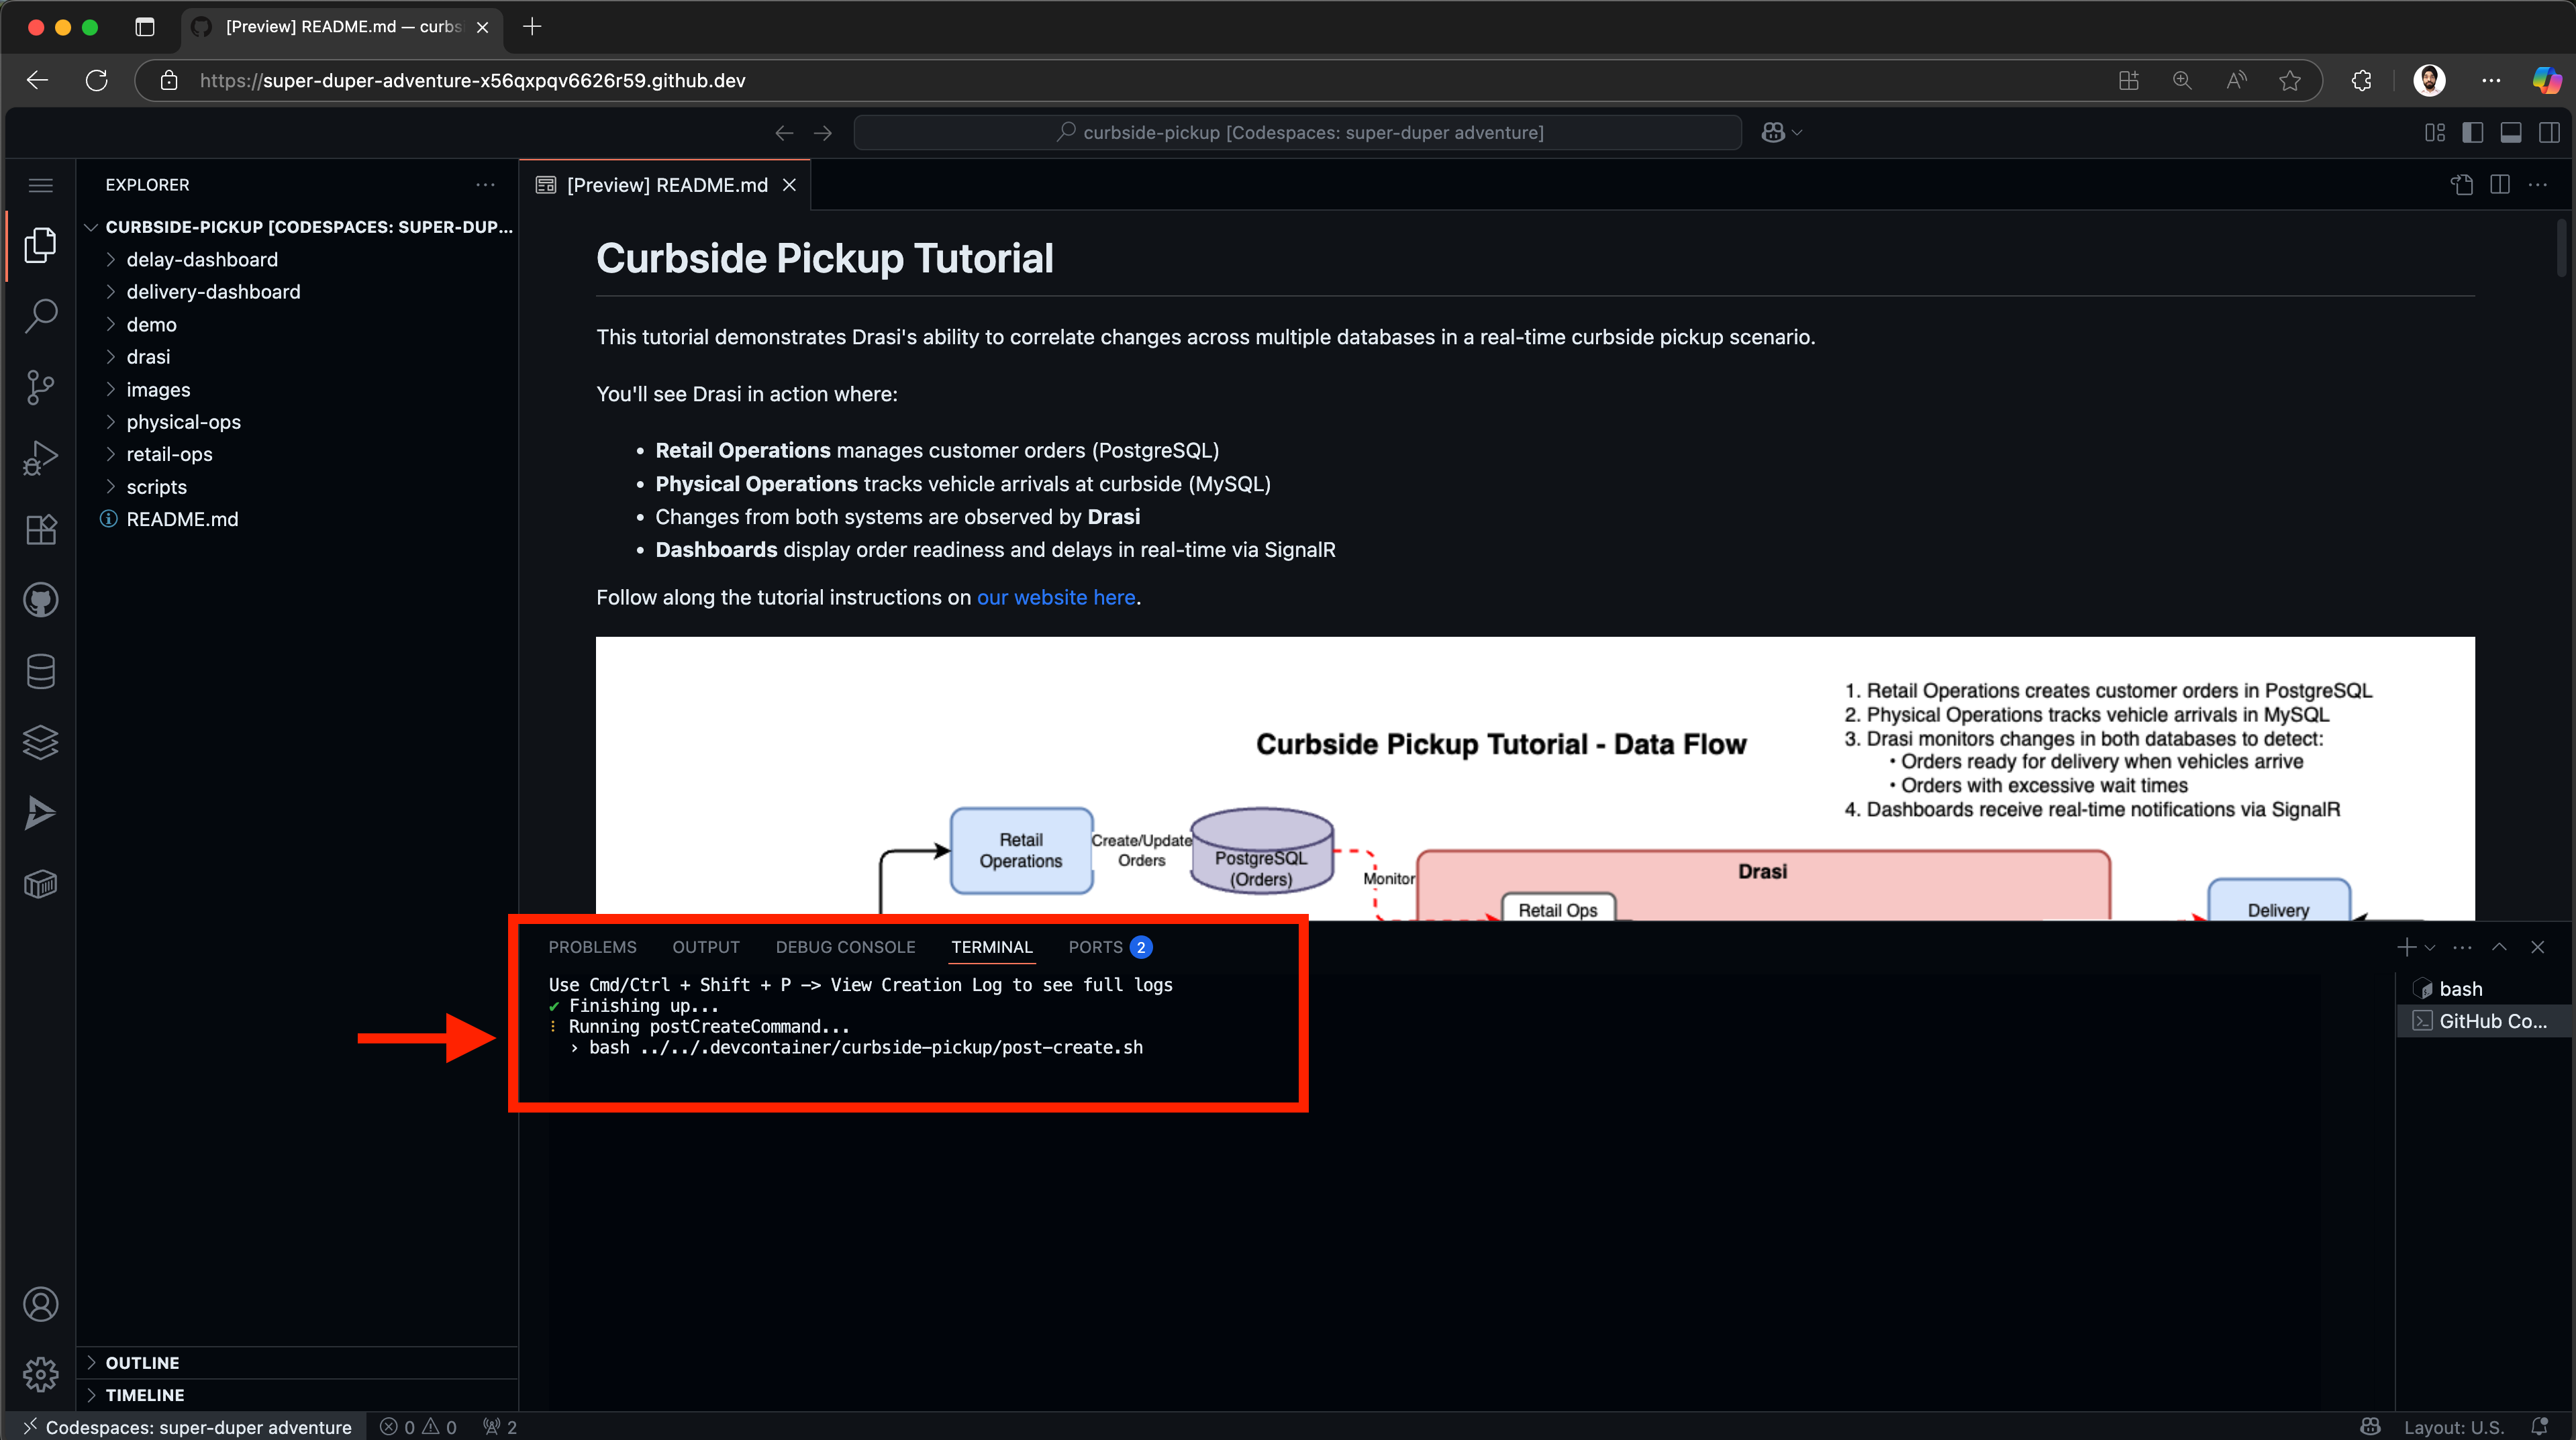
Once the setup is complete successfully, you should see a welcome message on the terminal, and the Readme file open:
To follow along with a Dev Container, you will need to install:
- Visual Studio Code (or Insiders Edition)
- Visual Studio Code Dev Containers extension
- docker
Next, clone the learning repo from Github, and open the repo in VS Code. Make sure that Docker daemon (or Docker Desktop) is running.
Once the solution is open in VS Code, follow these steps:
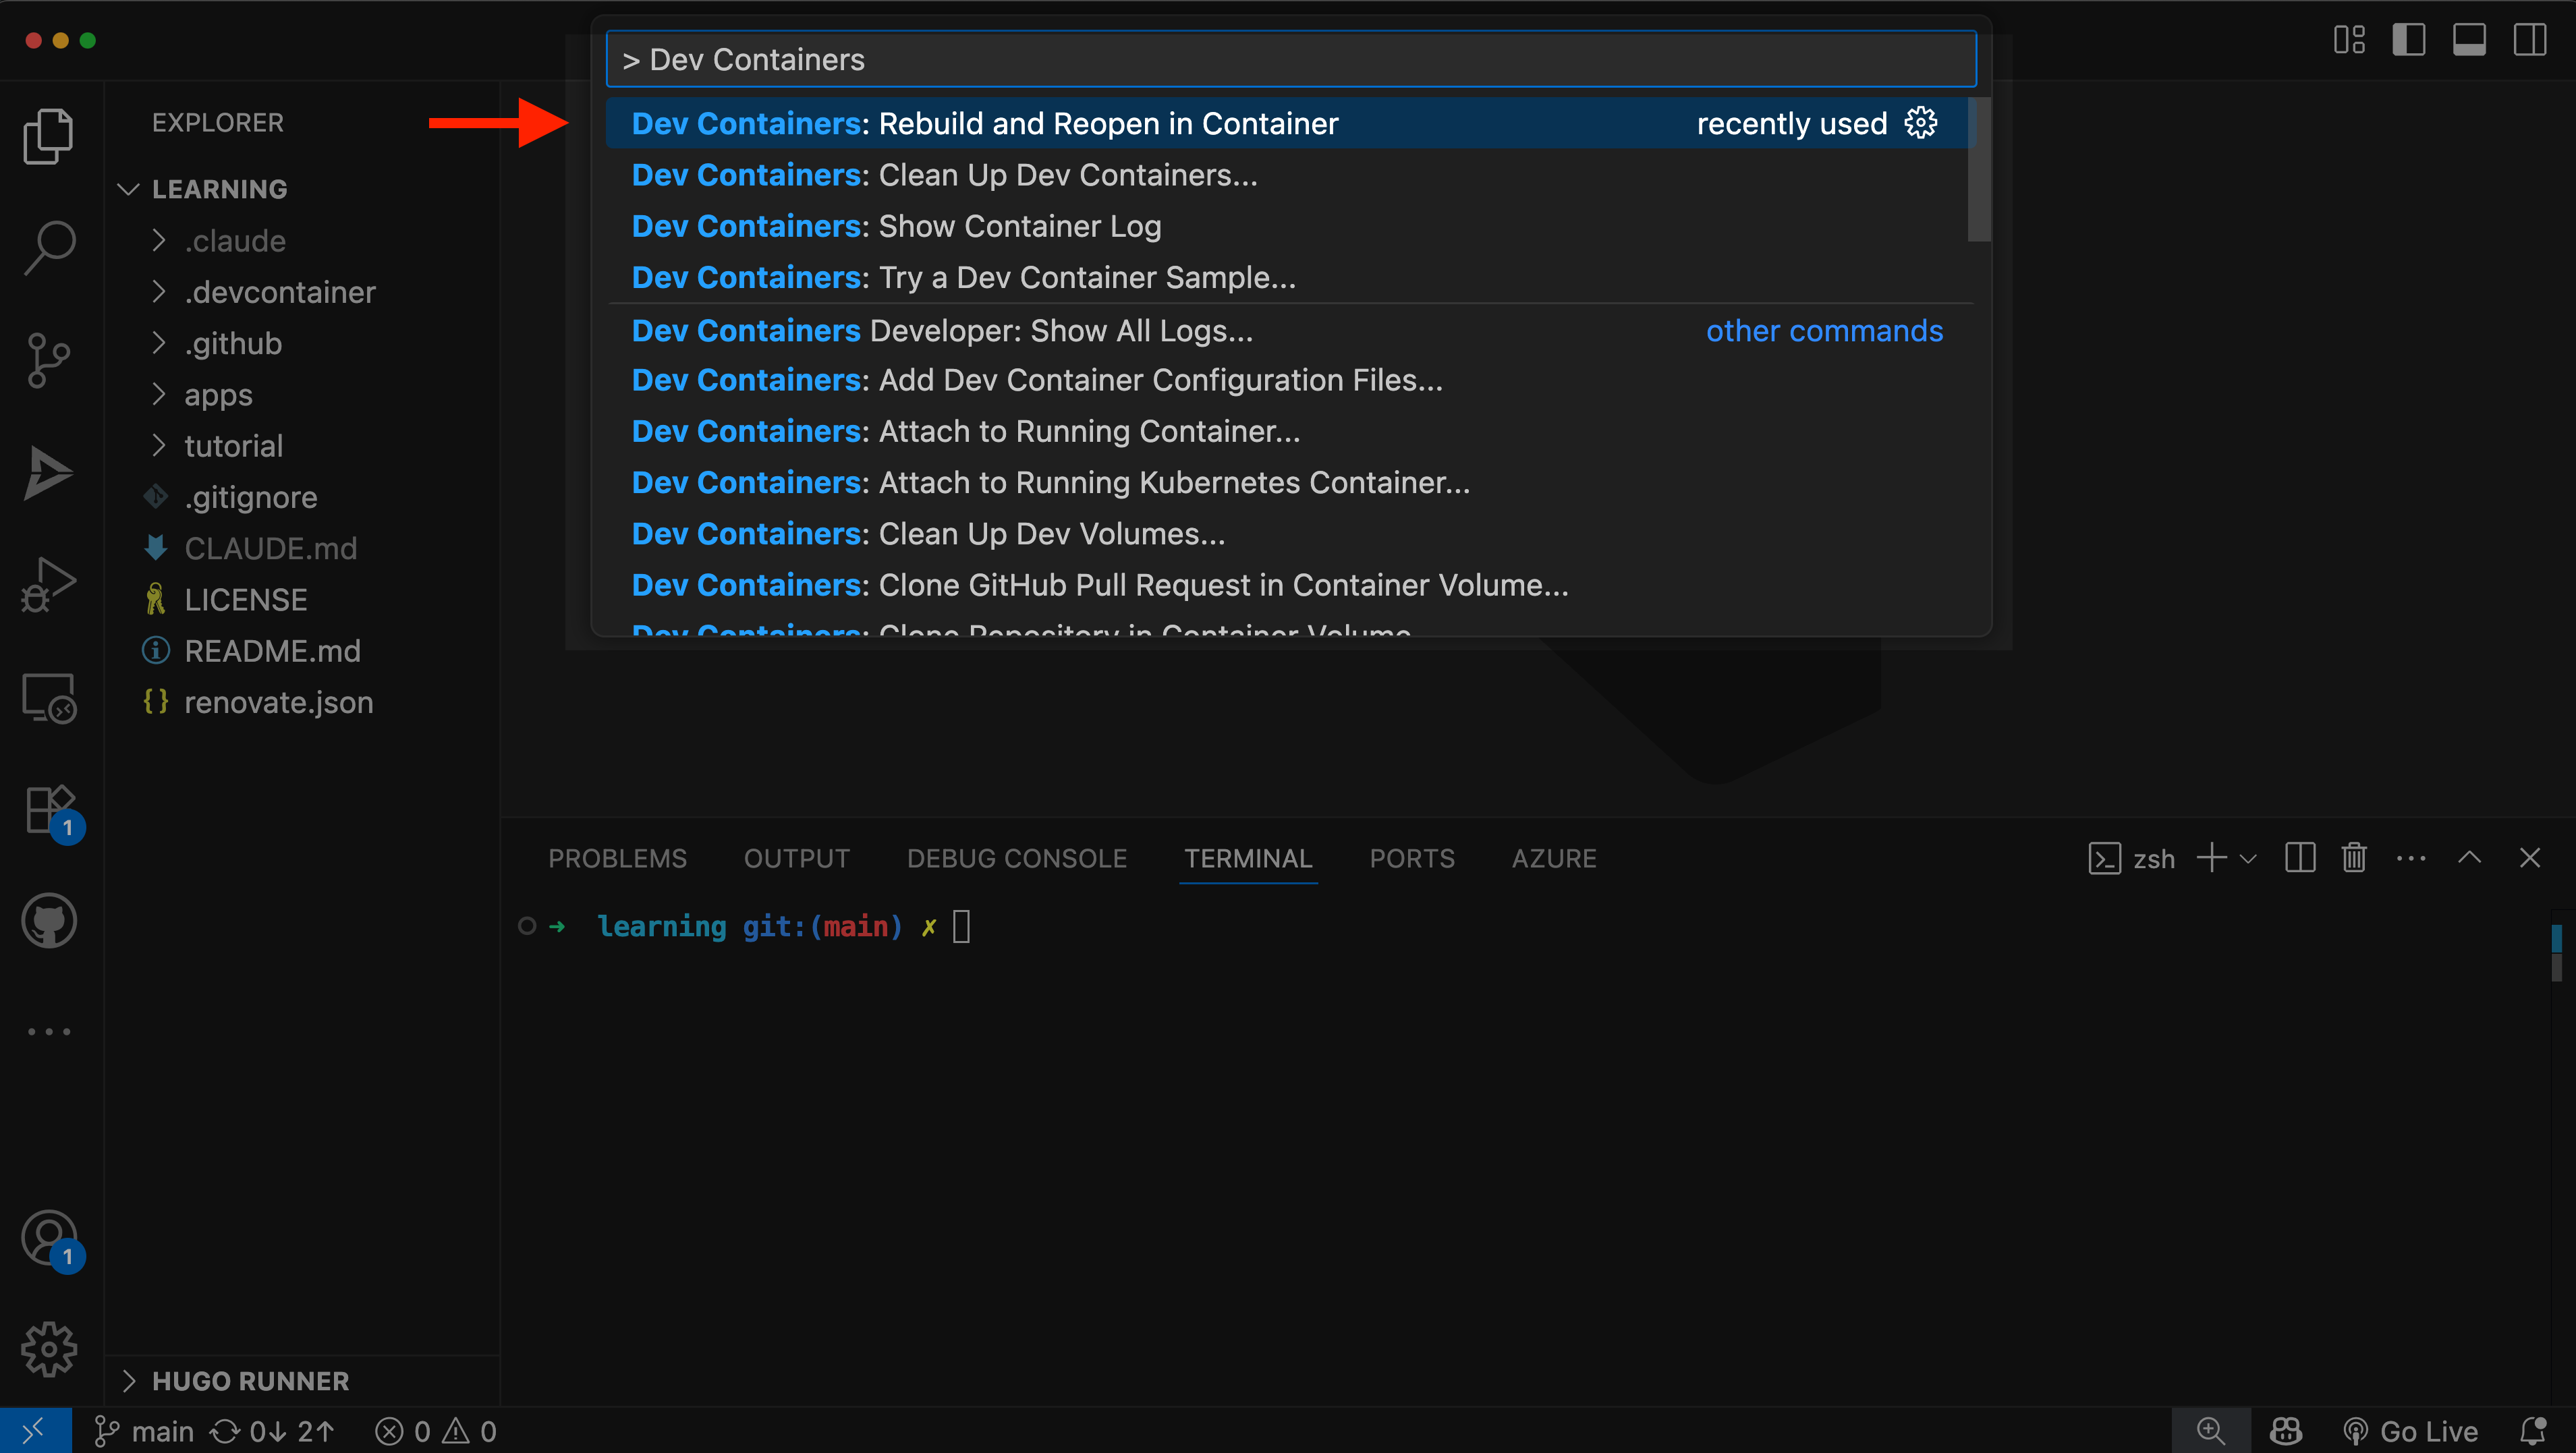
- Press Cmd + Shift + P (on MacOS) or Ctrl + Shift + P (Windows or Linux) to launch the command palette.
- Select
Dev Containers: Rebuild and Reopen in Container.
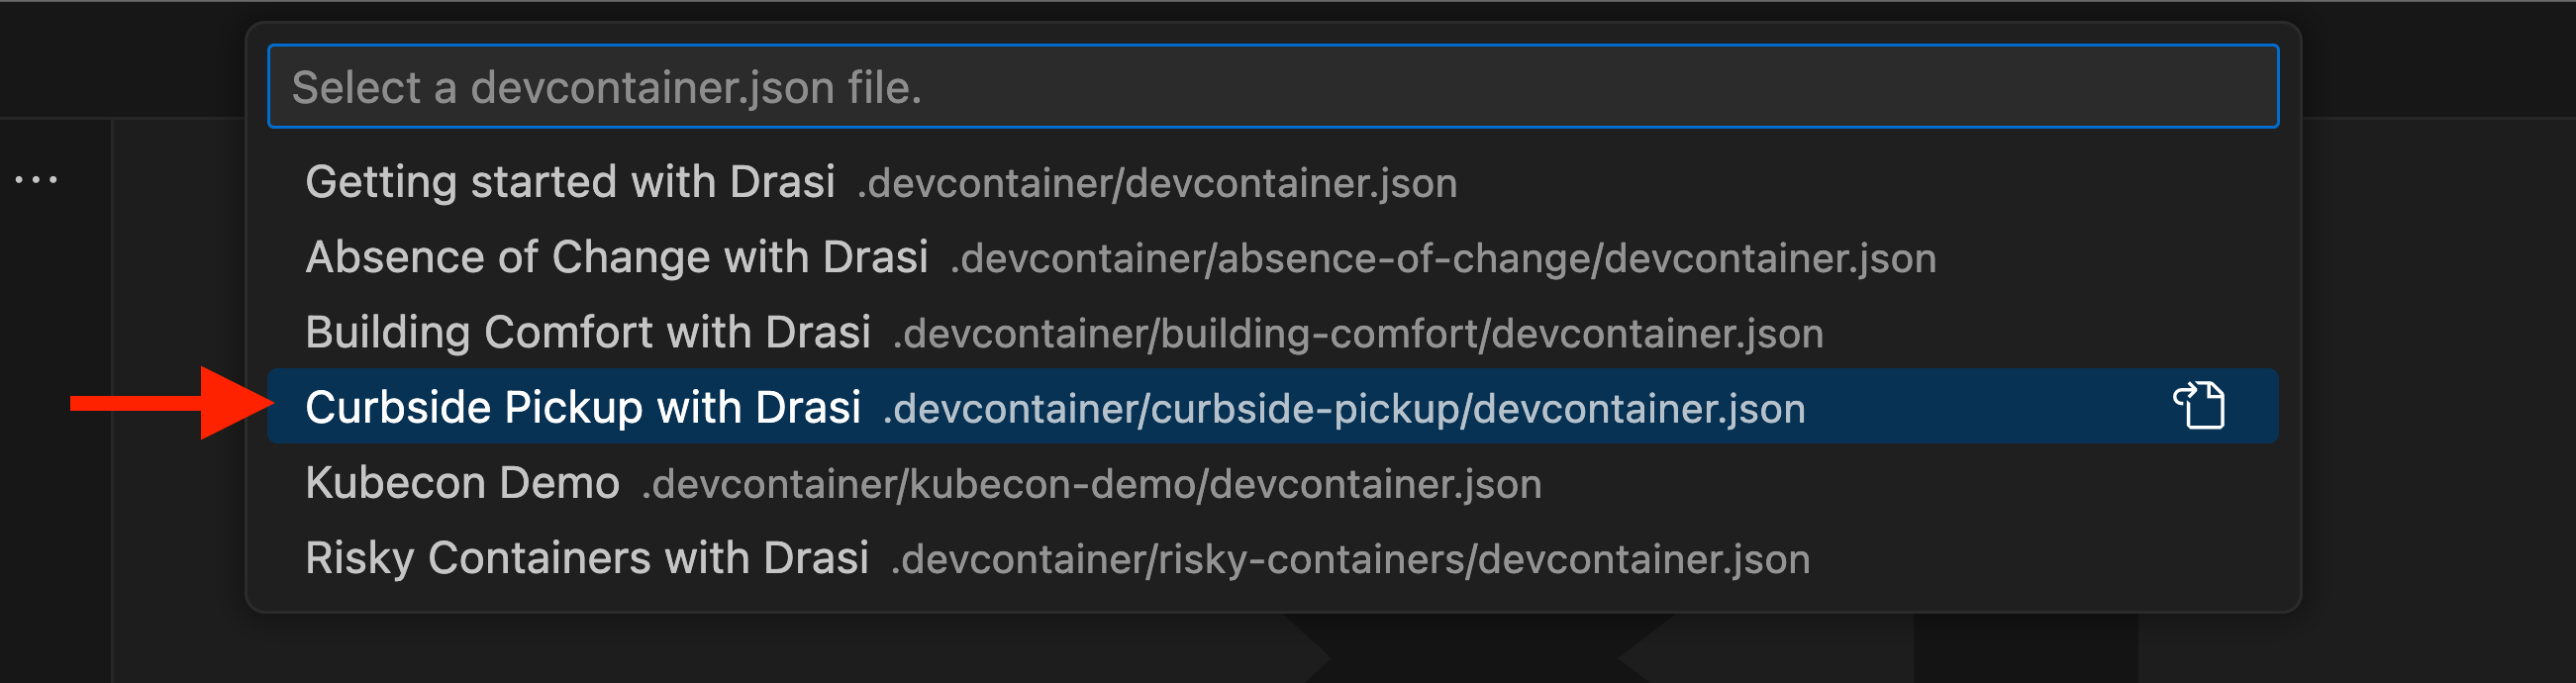
- Select the
Curbside Pickup with Drasioption to launch this tutorial.
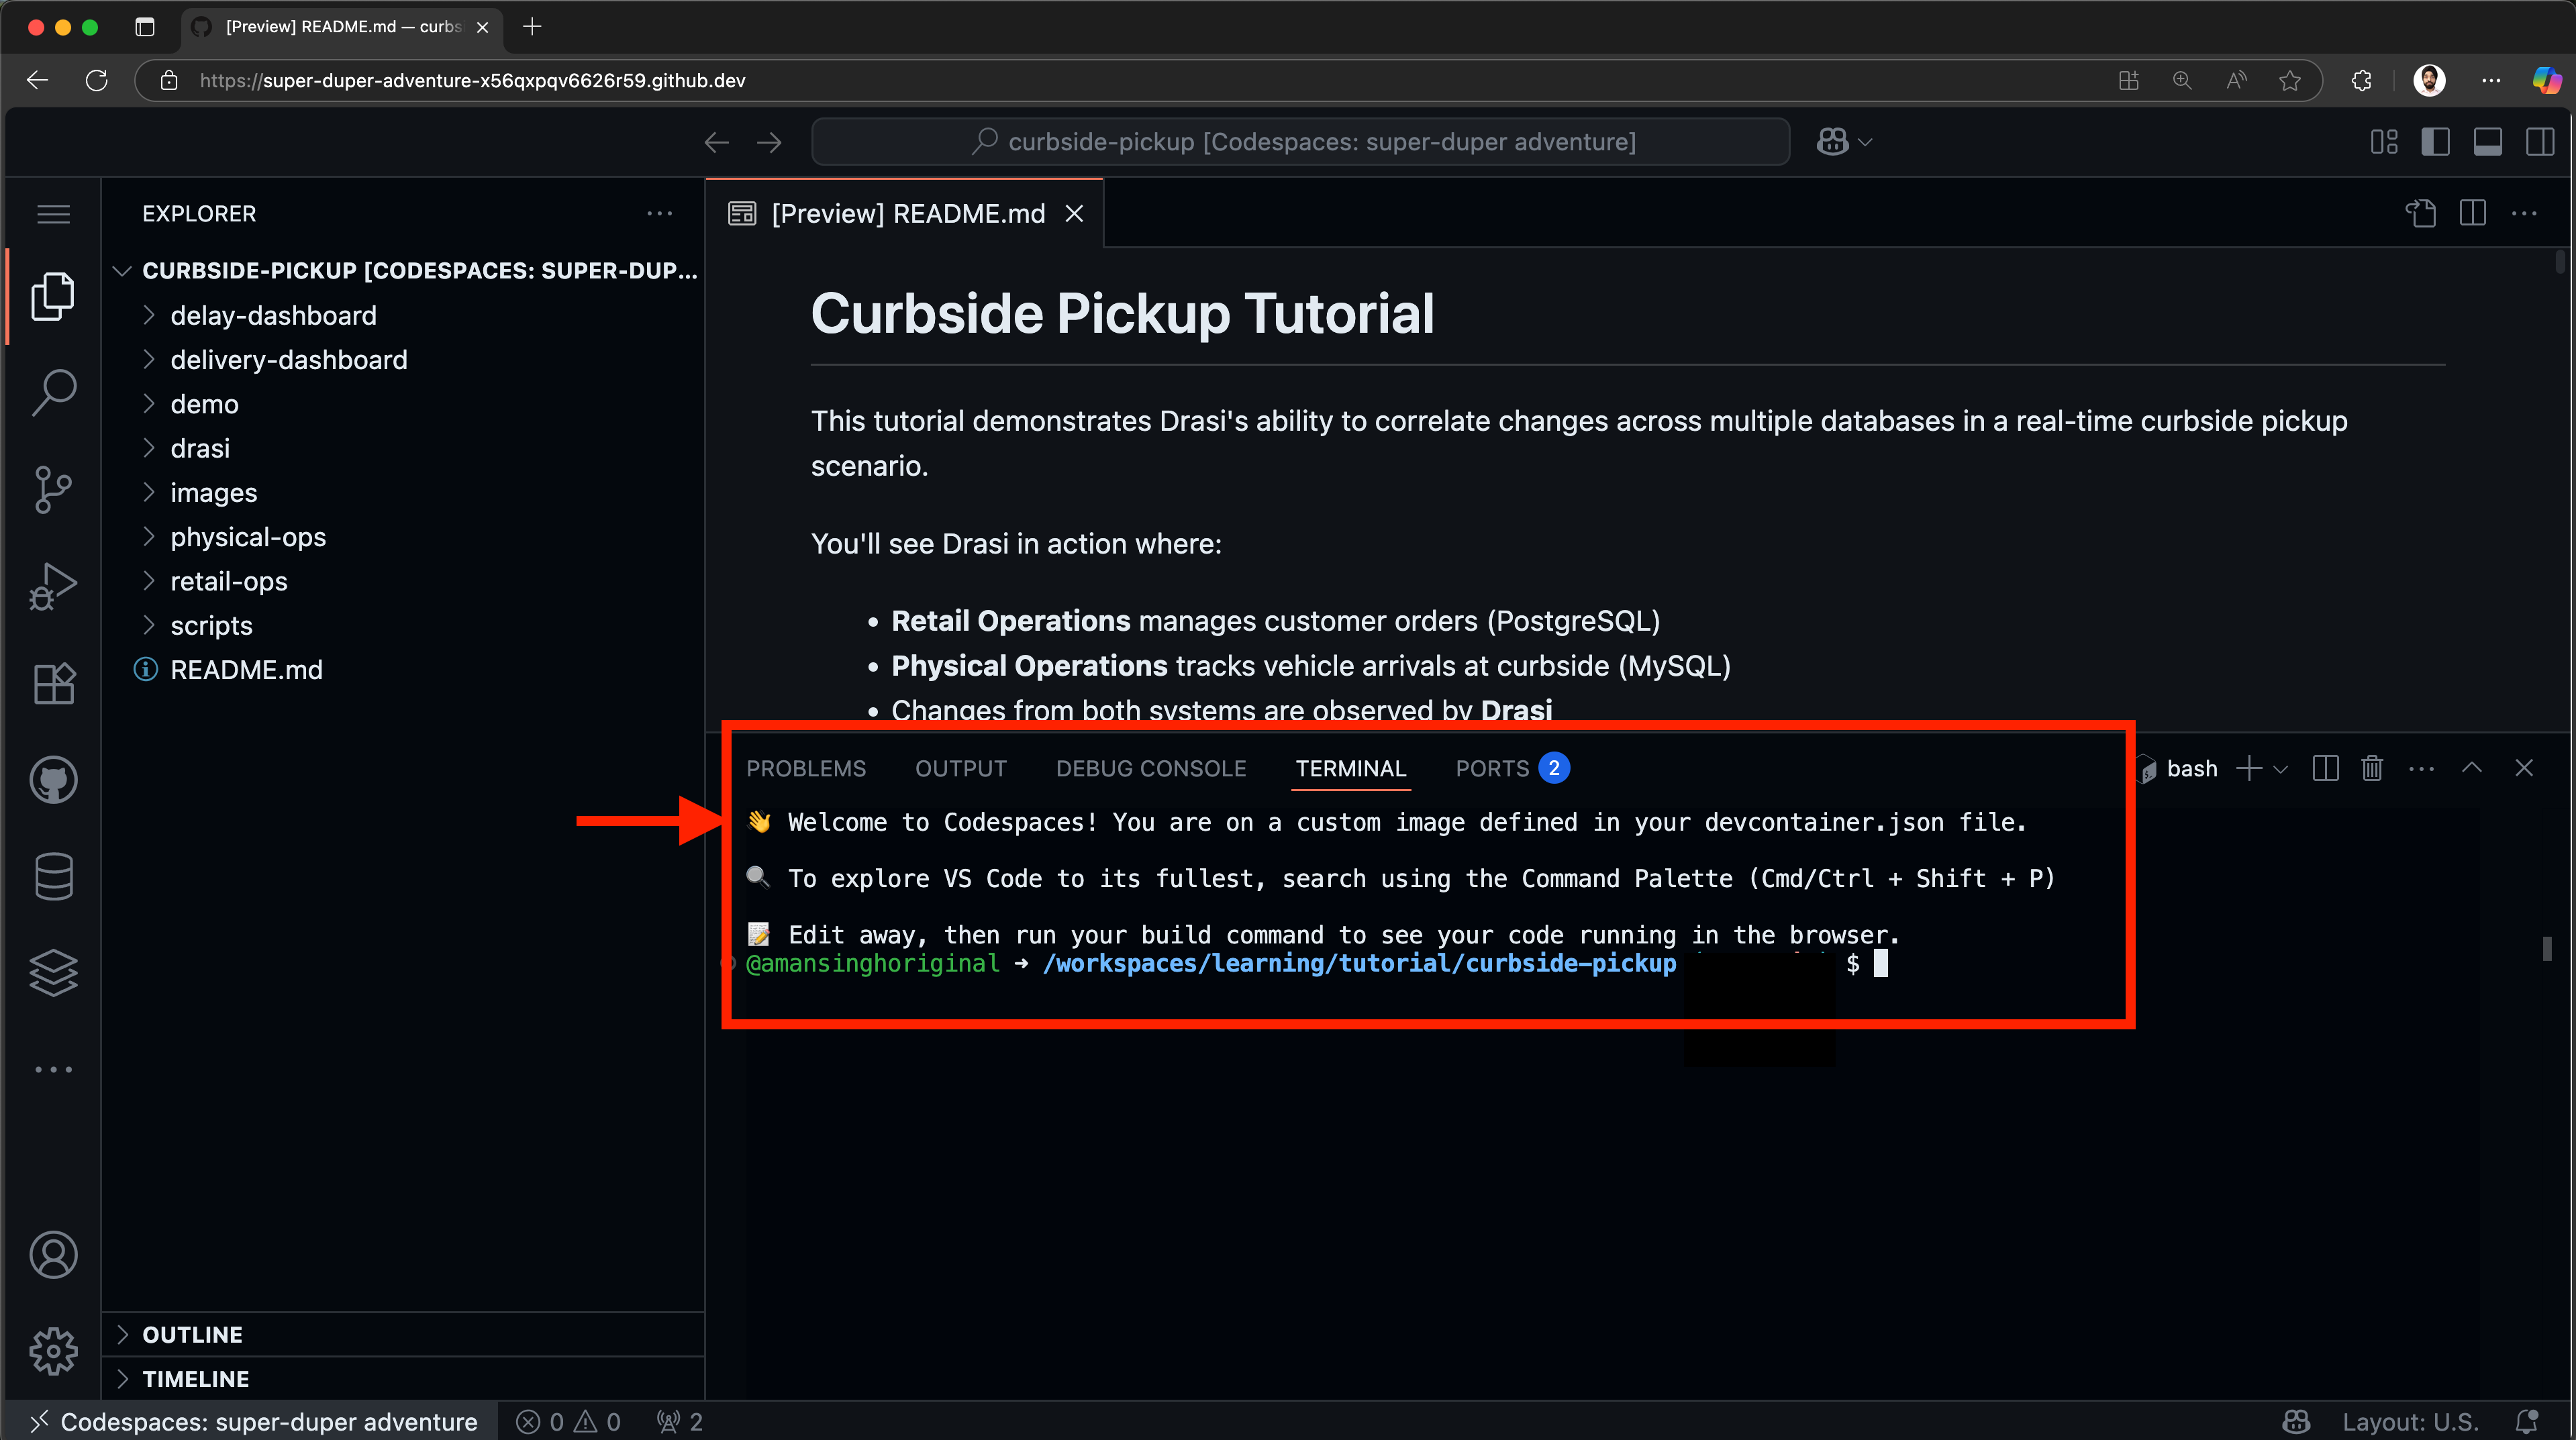
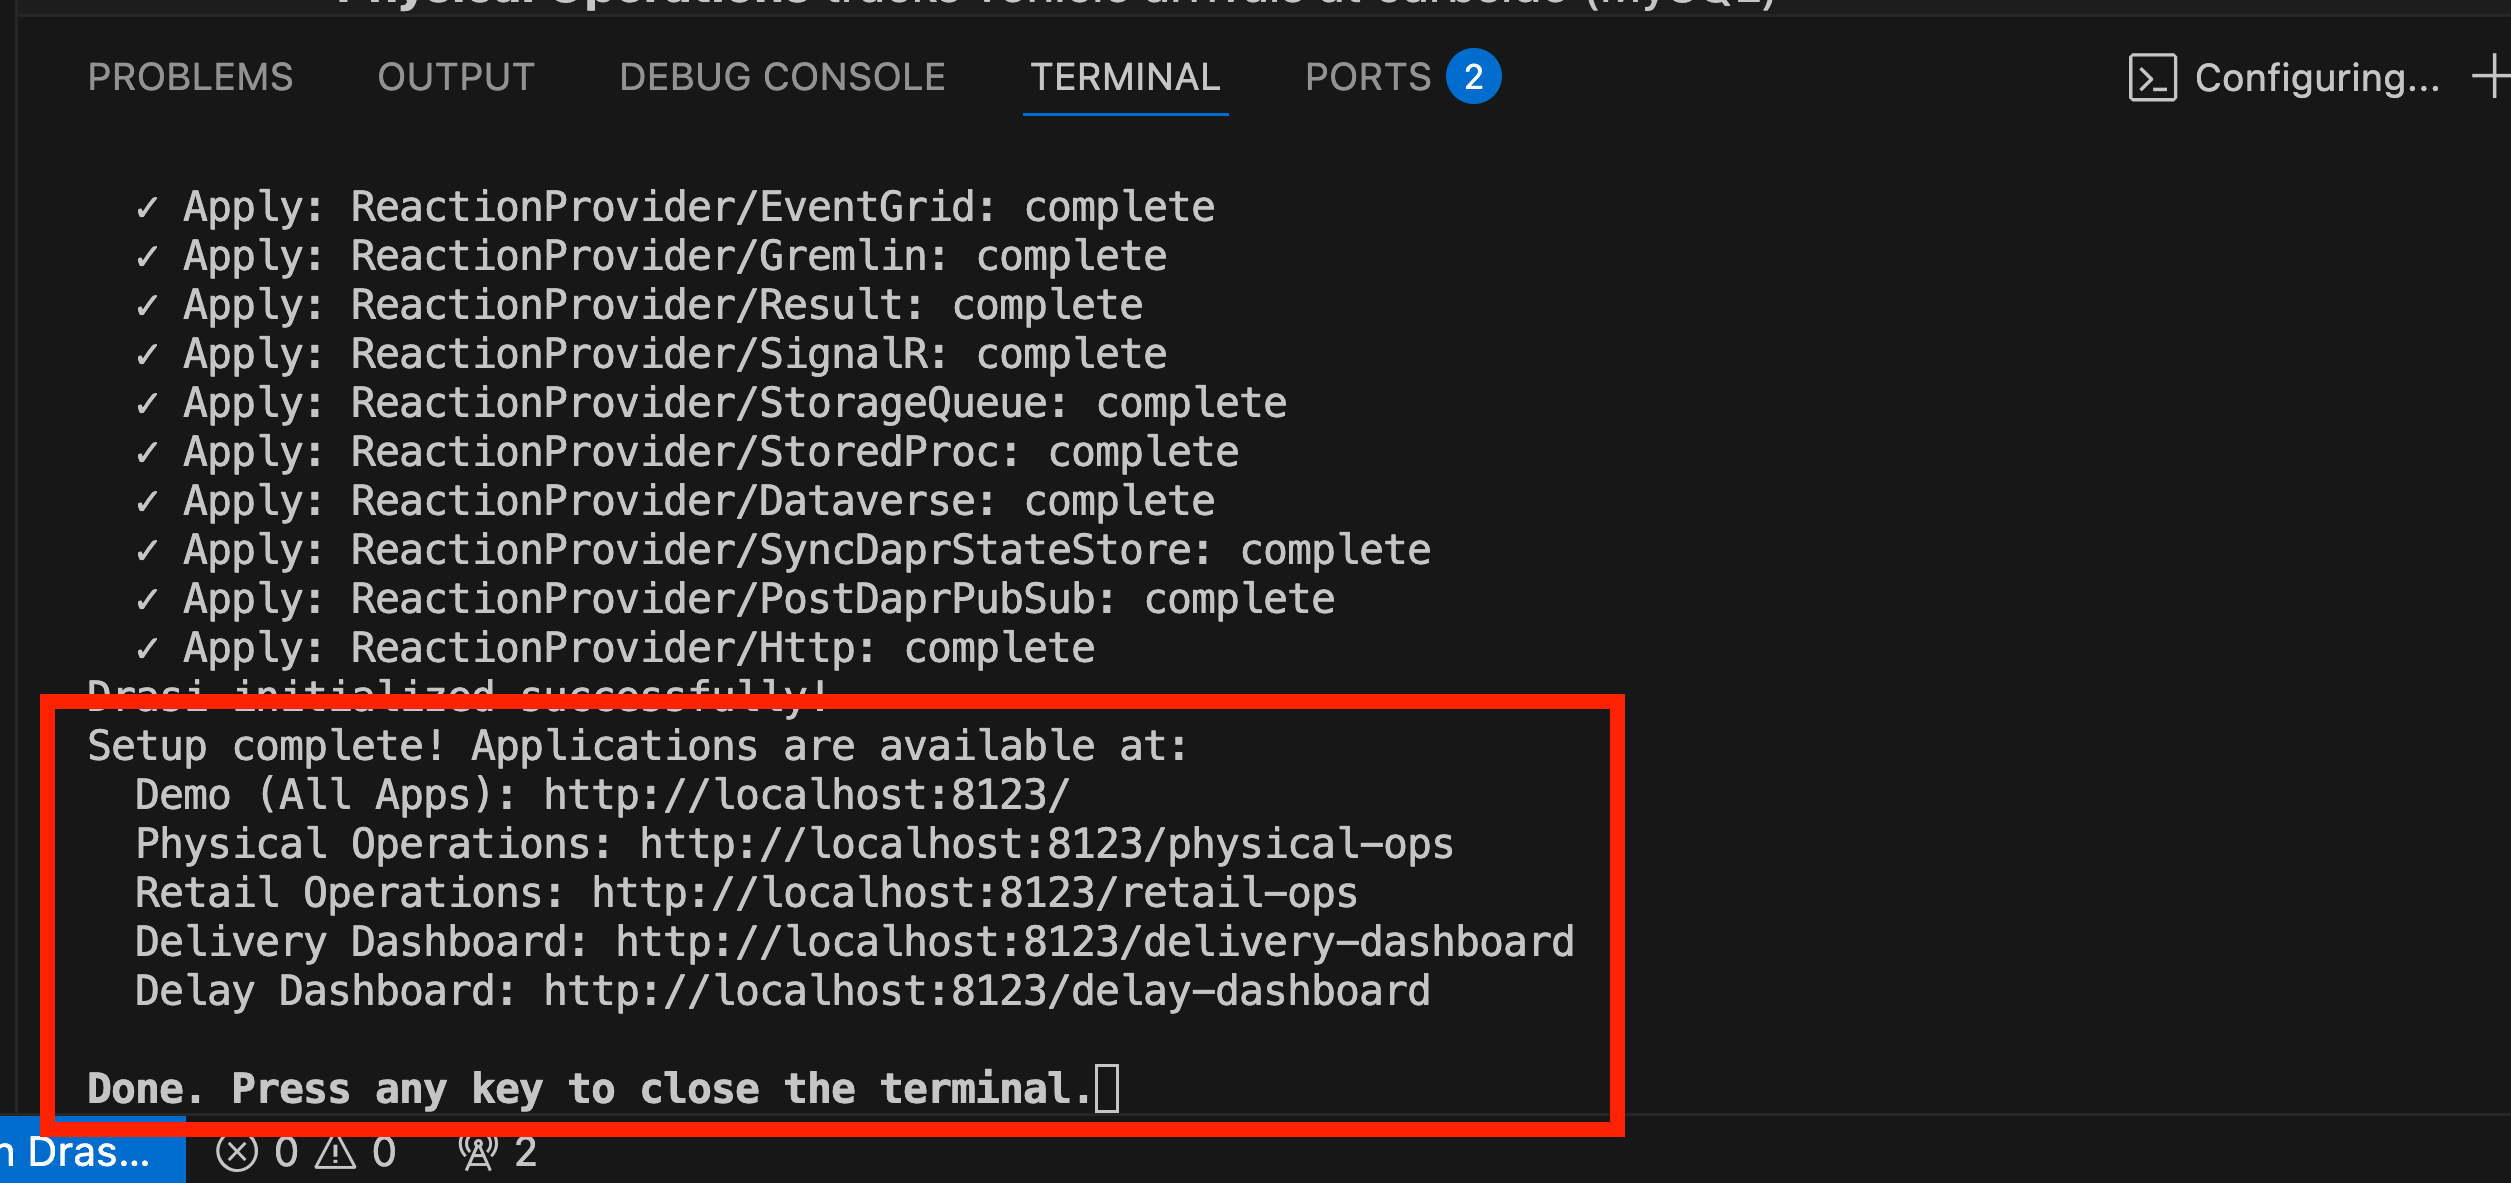
This will create a container and set it up for you. This might take up to 5 minutes and will look something like this:
Once the setup is complete, you will see a message like this in the VSCode Terminal:
To run this tutorial locally, you’ll need:
- Docker (for running k3d)
- kubectl installed and configured
- k3d installed (for creating local Kubernetes clusters)
- Drasi CLI installed
For optimal performance with the Drasi Dev Container, we recommend configuring Docker with the following minimum resources:
- CPU: 3 cores or more
- Memory: 4 GB or more
- Swap: 1 GB or more
- Disk: 50 GB available space
To adjust these settings in Docker Desktop:
- Open Docker Desktop
- Go to Settings (gear icon)
- Navigate to “Resources” → “Advanced”
- Adjust the sliders to meet or exceed the recommended values
- Click “Apply & Restart”
Step 1: Clone the learning repo
Clone the learning repo from Github,
and navigate to the curbside pickup directory (learning/tutorial/curbside-pickup)
git clone https://github.com/drasi-project/learning
cd learning/tutorial/curbside-pickup
Step 2: Create k3d cluster
The setup script requires a running Kubernetes cluster. Create one before proceeding:
# Create k3d cluster with port mapping
k3d cluster create drasi-tutorial -p '8123:80@loadbalancer'

# Verify kubectl can connect (should show cluster info)
kubectl cluster-info
This creates a cluster with Traefik v2.x ingress controller included. The port mapping 8123:80 allows you to access applications at http://localhost:8123.
Step 3: Run the setup script
Once your cluster is ready, run the interactive setup script for your platform:
For macOS/Linux:
cd tutorial/curbside-pickup
./scripts/setup-tutorial.sh
For Windows (PowerShell):
cd tutorial\curbside-pickup
.\scripts\setup-tutorial.ps1
The script will:
- Check for required tools (kubectl, Drasi CLI)
- Deploy PostgreSQL and MySQL databases with sample data
- Deploy all containerized applications
- Optionally initialize Drasi (you can skip this and do it later)
- Configure ingress routes (required - setup will fail if Traefik v2.x is not available)
Understanding the environment
Once your environment is ready, all applications sit behind an ingress, and are accessible through a single entry point.
The following applications are containerized and deployed on Kubernetes:
- Retail Operations with PostgreSQL DB (
/retail-ops)
- Used to manage Orders
- PostgreSQL database for orders
- FastAPI backend + React frontend
- Pre-loaded with sample data
- Physical Operations with MySQL DB (
/physical-ops)
- Used to manage vehicles
- MySQL database for vehicles
- Flask backend + React frontend
- Pre-loaded with sample data
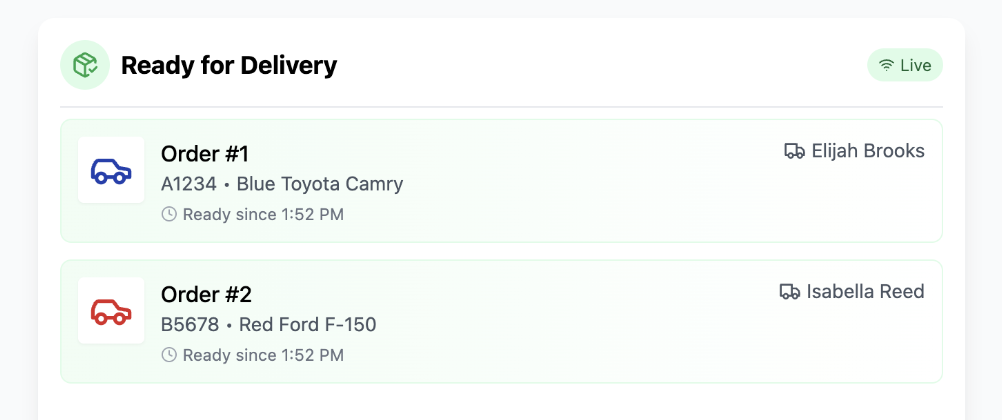
- Delivery Dashboard (
/delivery-dashboard)
- React app with SignalR integration
- Shows orders that are ready and the respective pickup drivers have arrived
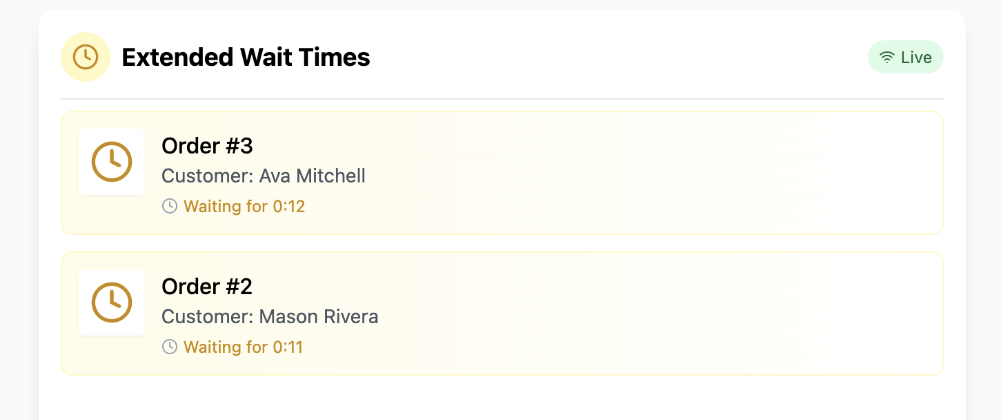
- Delay Dashboard (
/delay-dashboard)
- Vue.js app with SignalR integration
- Shows delayed orders for which drivers are waiting in pickup zone
Once your codespace is ready, open the Ports tab:
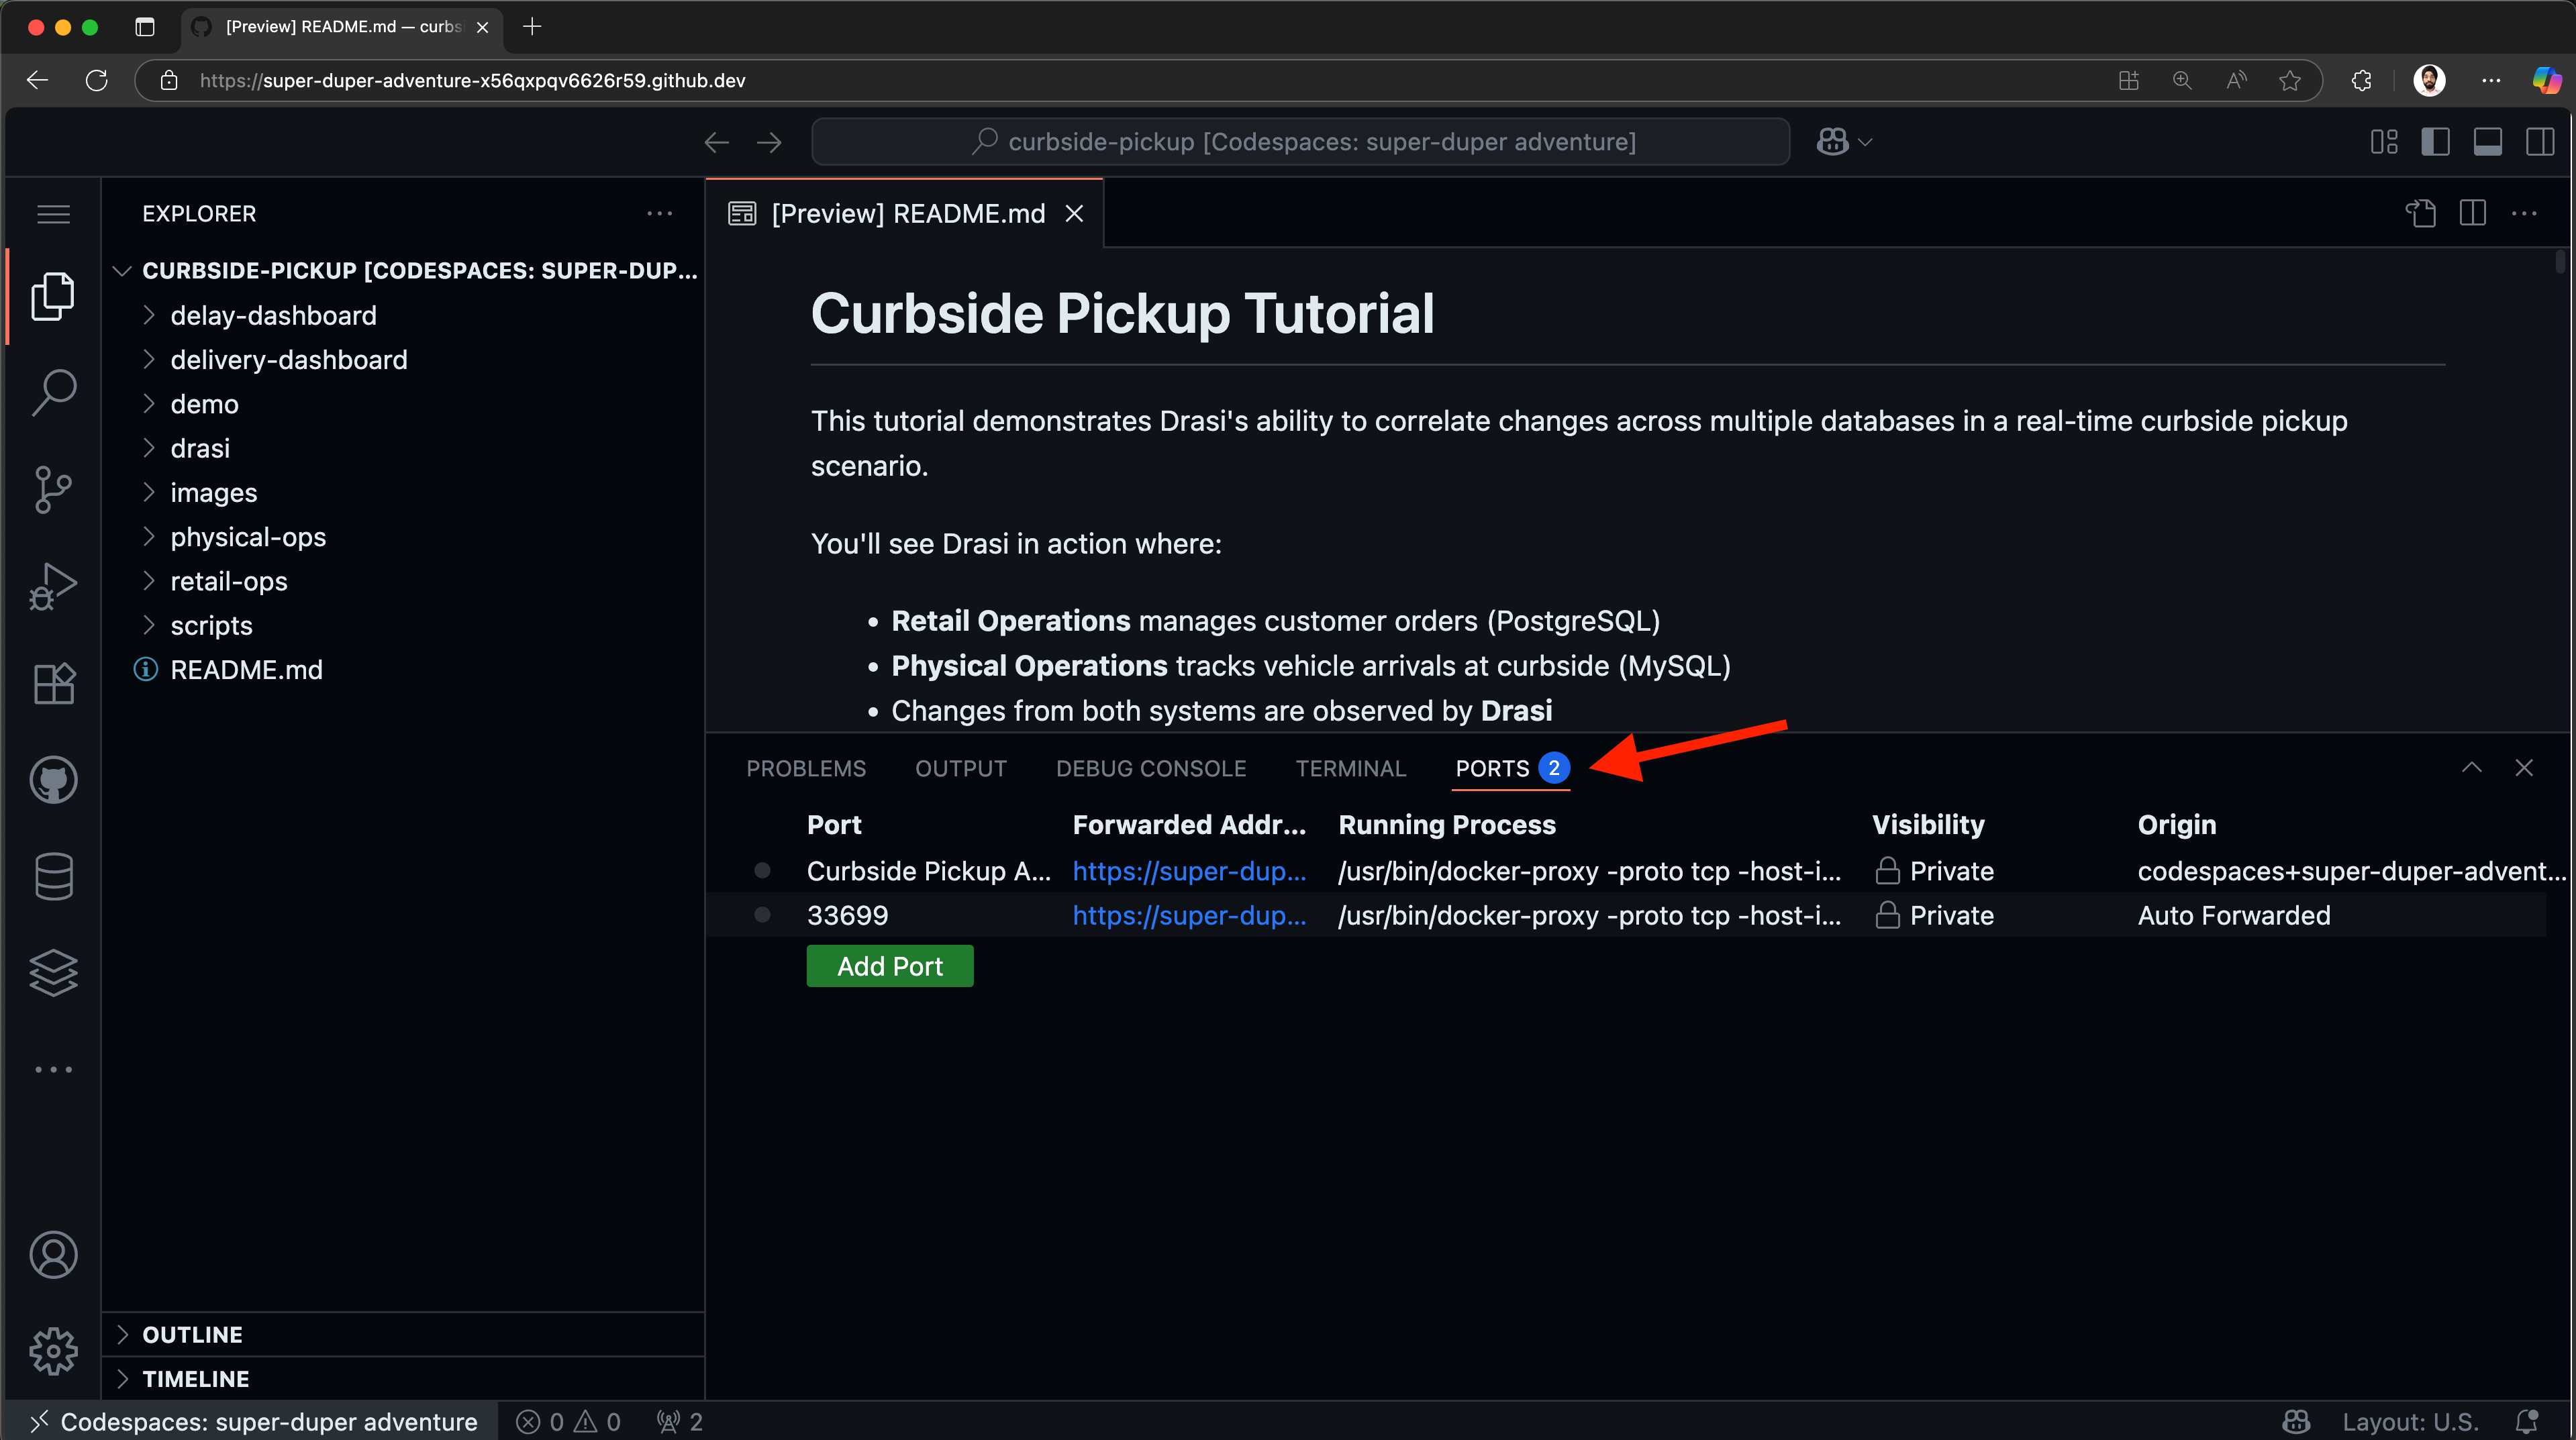
You should see a port already exported for “Curbside Pickup Apps”. Hover on the forwarded address and click on the button “Open in Browser”.
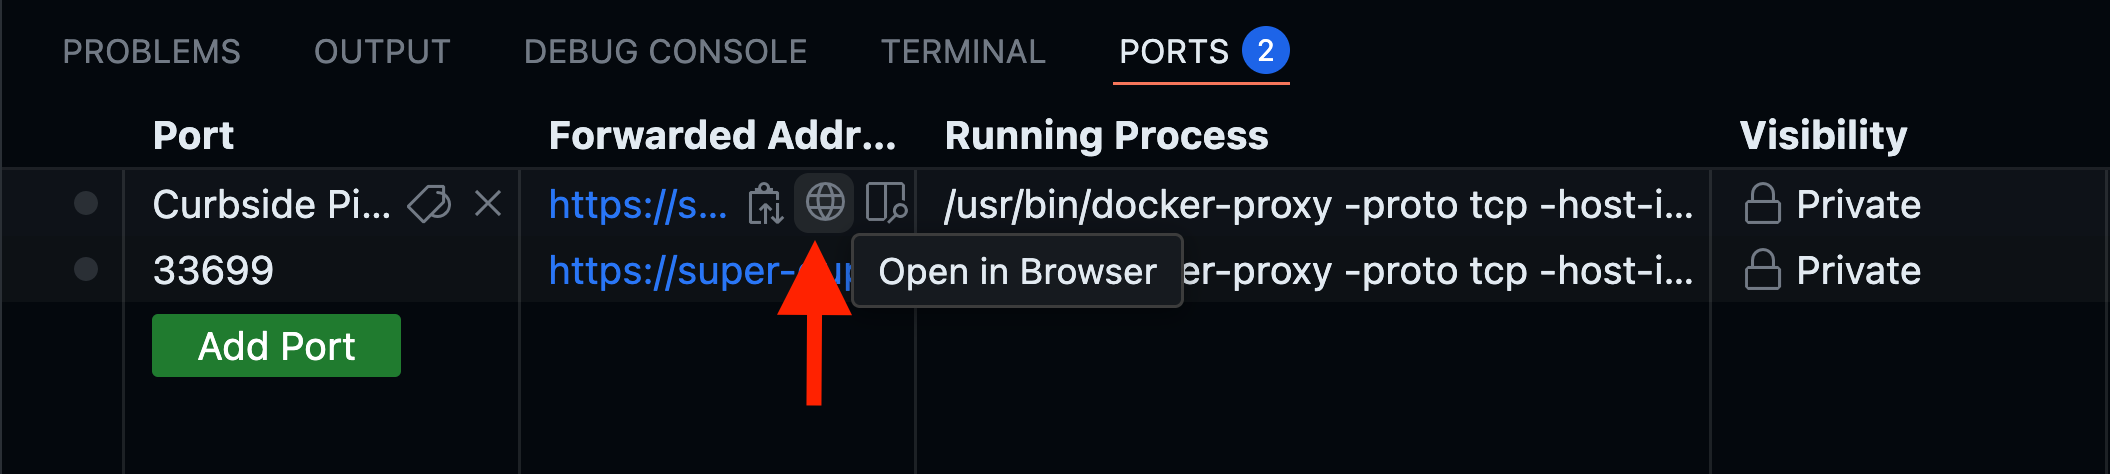
This will open up a URL (something like https://<your-codespace-id>-8123.app.github.dev/) in a new tab.
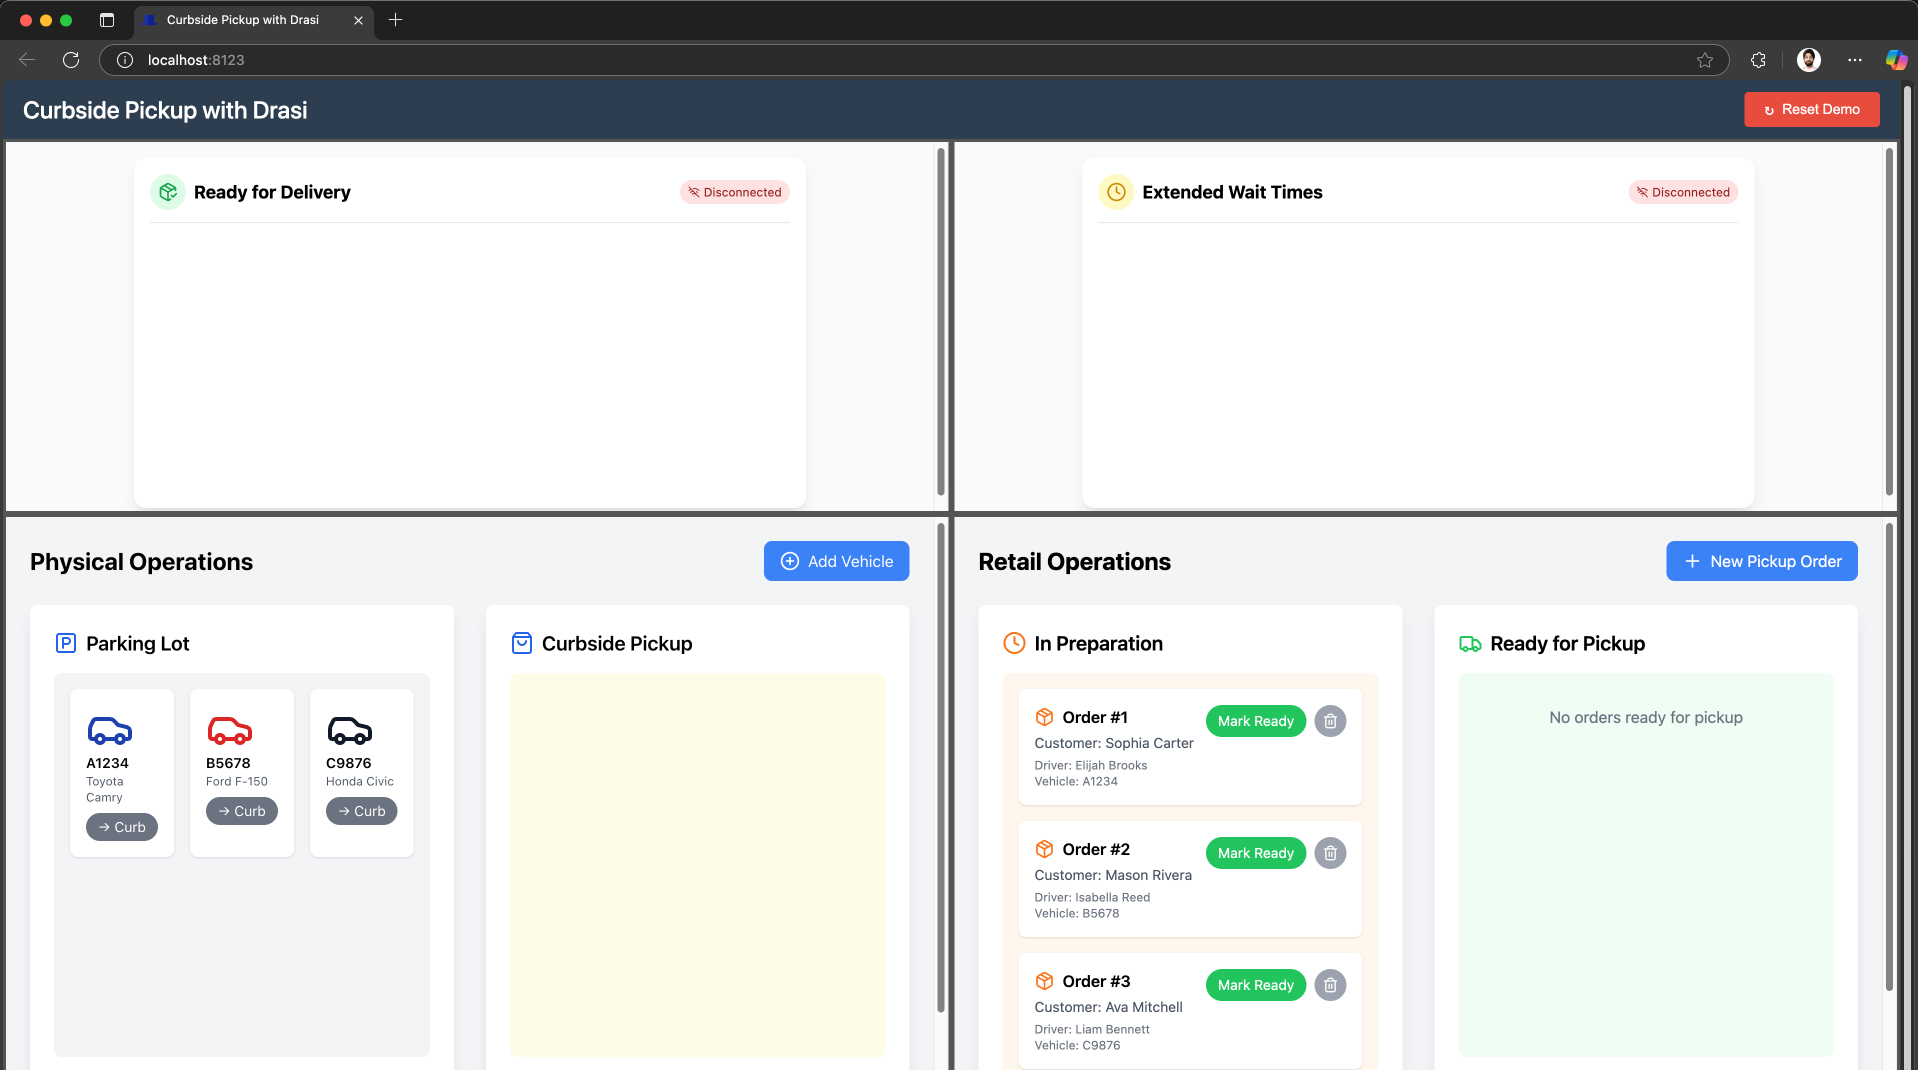
You should see a disconnected demo page like shown below.
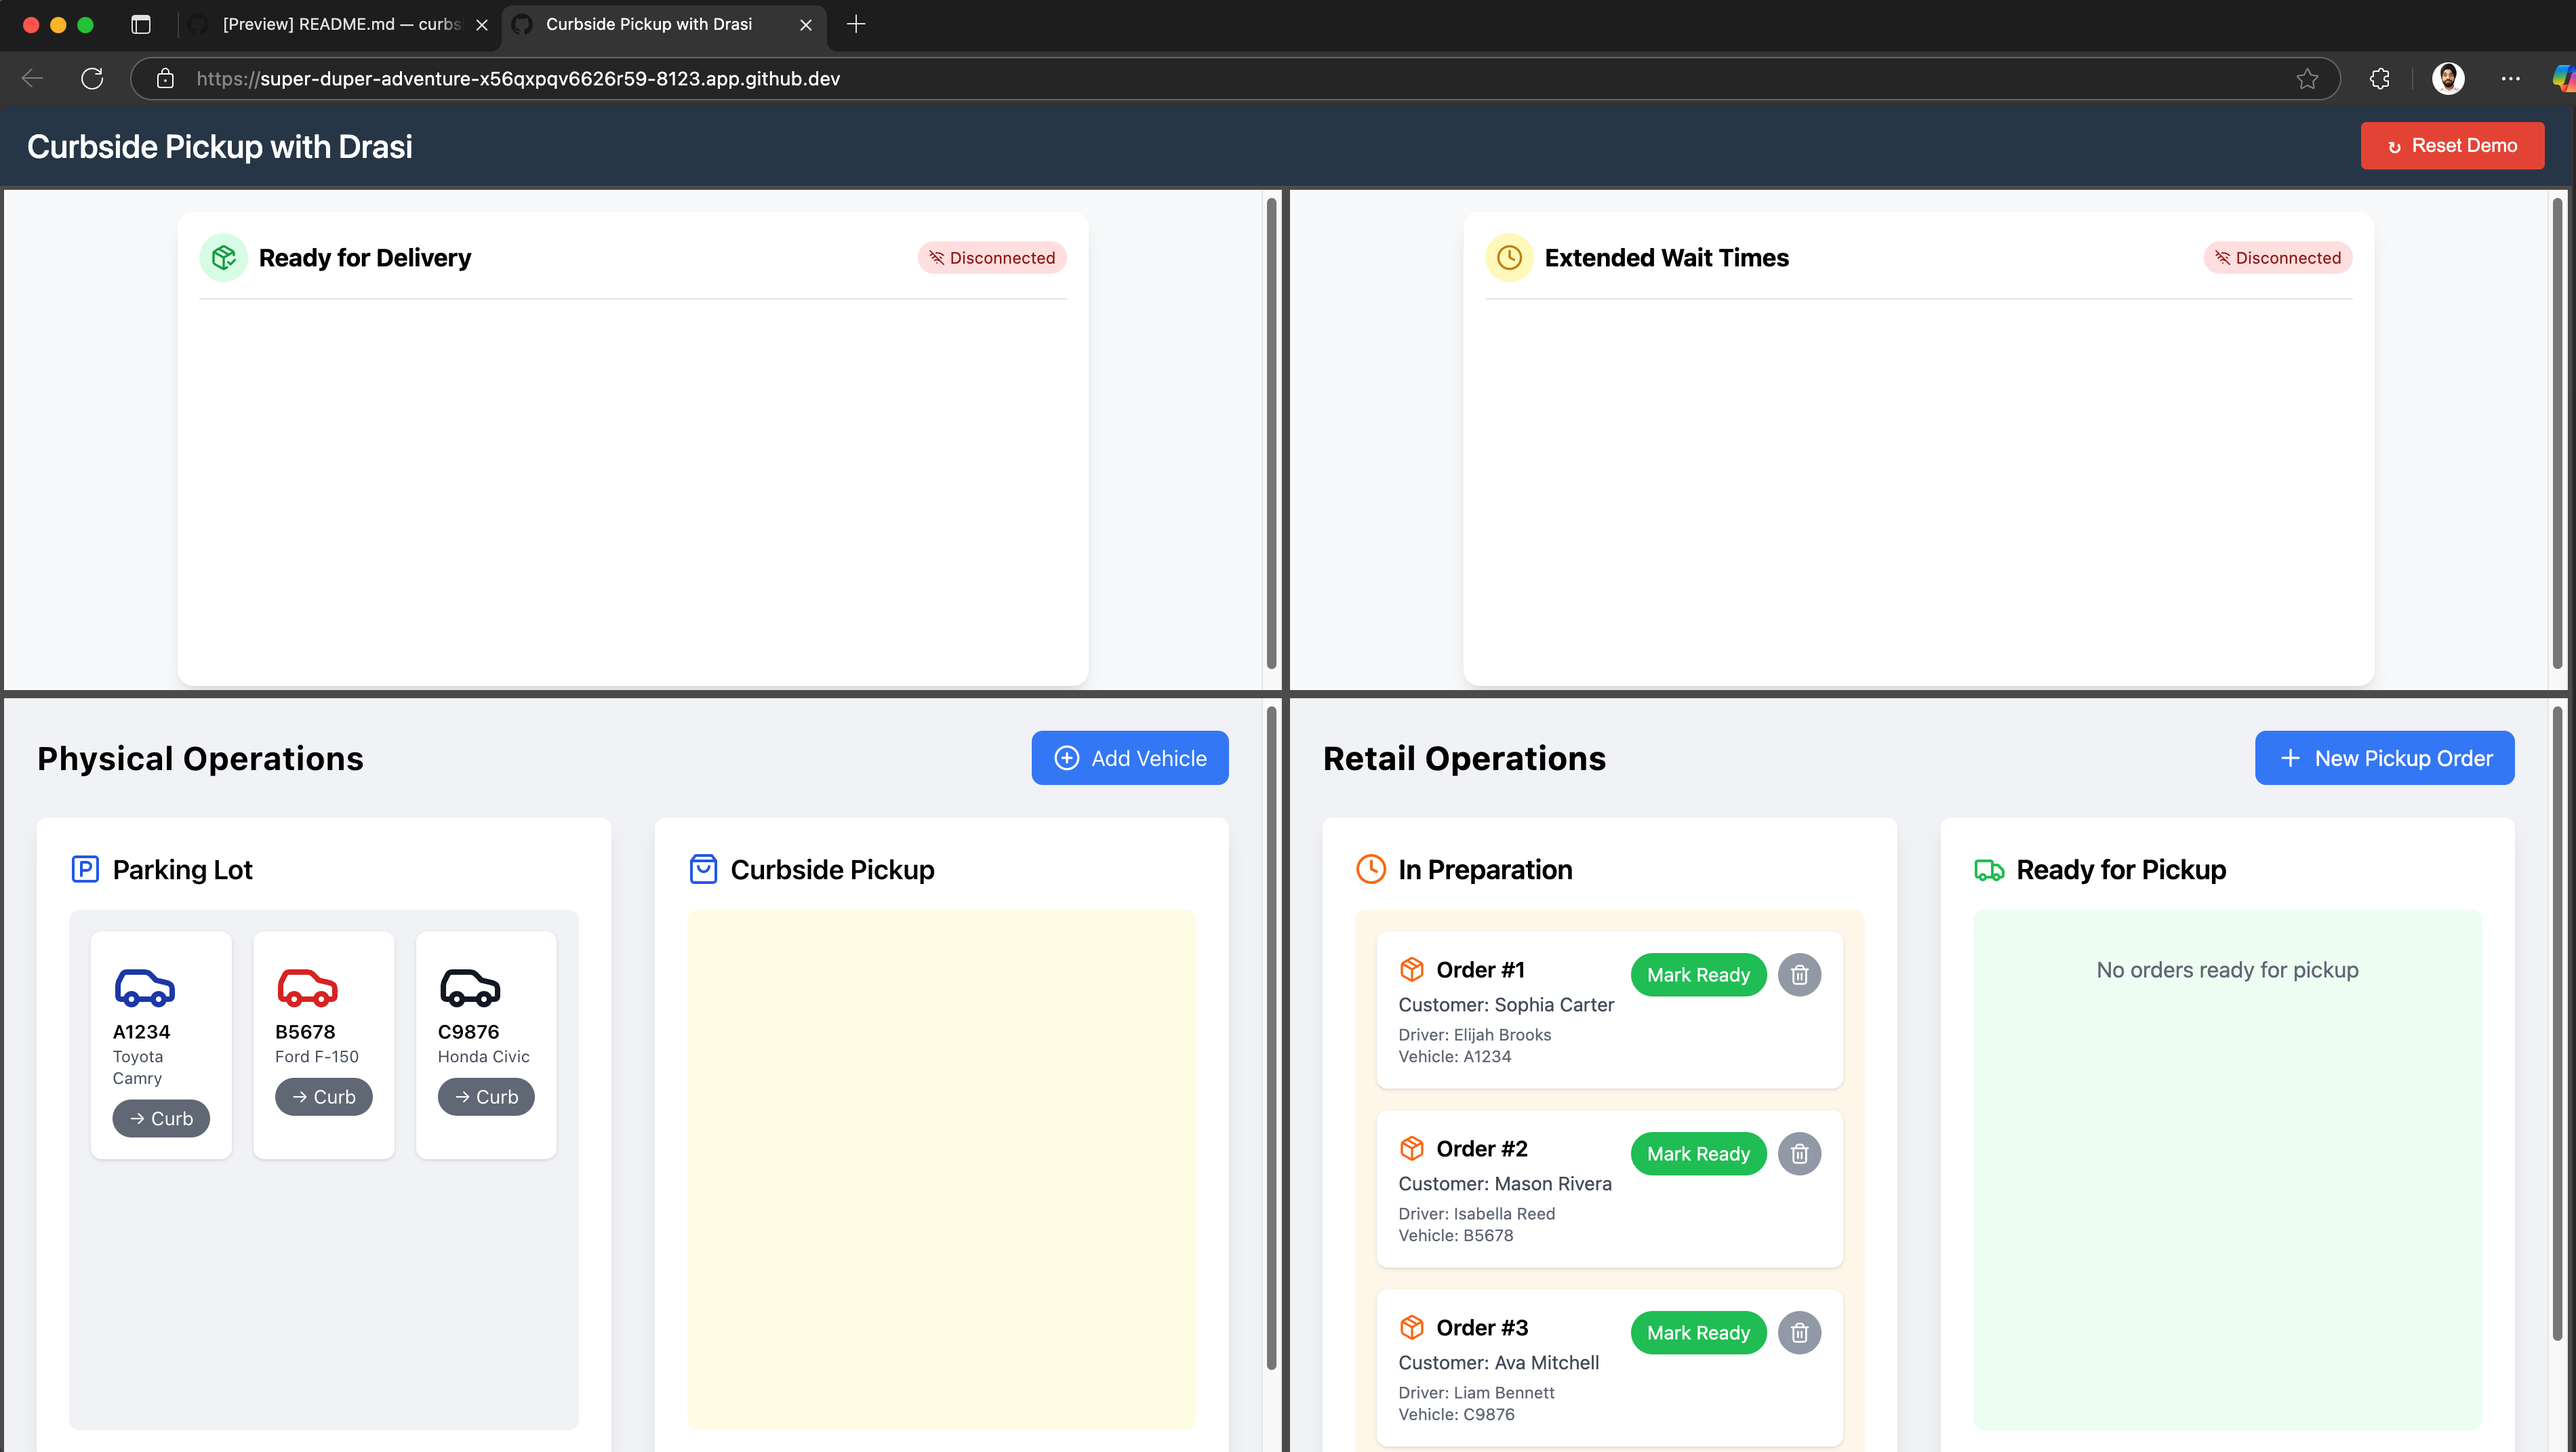
Note: This page shows Disconnected because the dashboards have no websocket backend yet. We will use Drasi to deploy a SignalR server which will work as our websocket backend.
🚀 If you’re able to see this, your environment is setup correctly and you can proceed.
👍 The dashboard is still blank because our websocket server is not deployed
⌛️ If your dashboard is not loading, or your codespace wasn’t setup, please try recreating your codespace.
🤨 If you keep running into issues, please reach the Drasi team at our discord channel and share your codespace creation logs.
Once your devcontainer is ready, open the Ports tab:
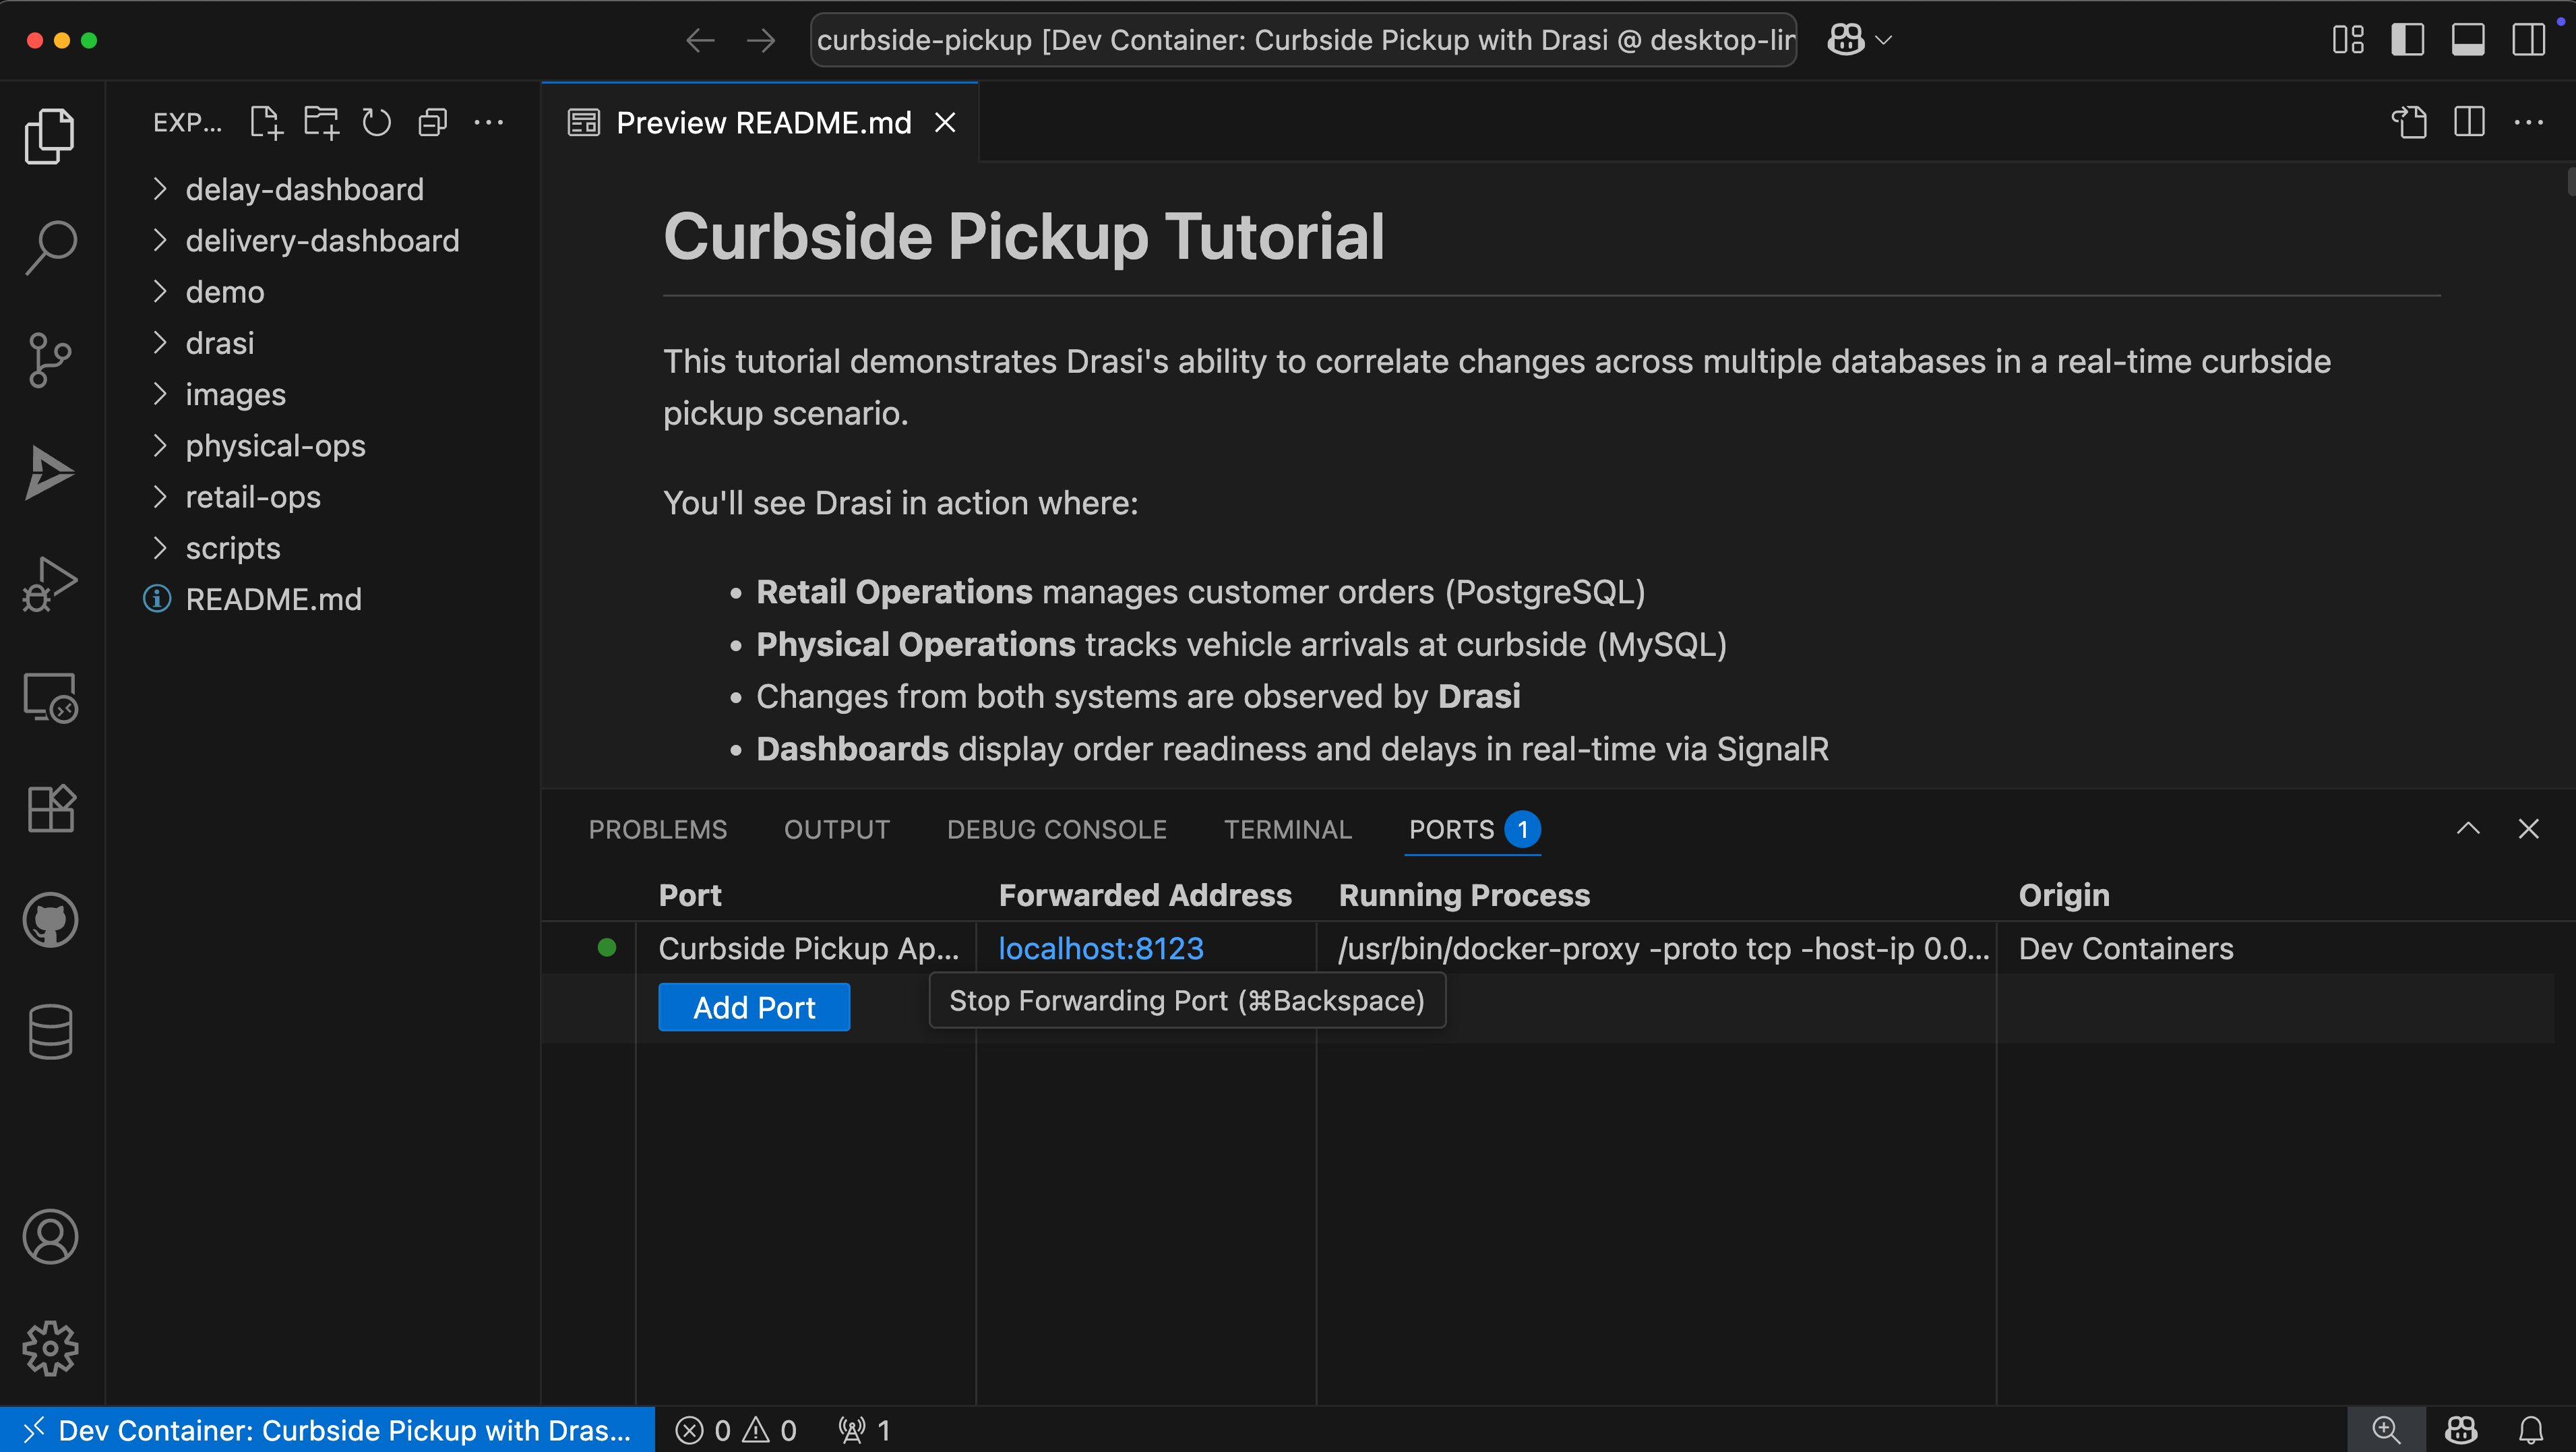
You should see a port already exported for “Curbside Pickup Apps”. Hover on the forwarded address and click on the button “Open in Browser”.
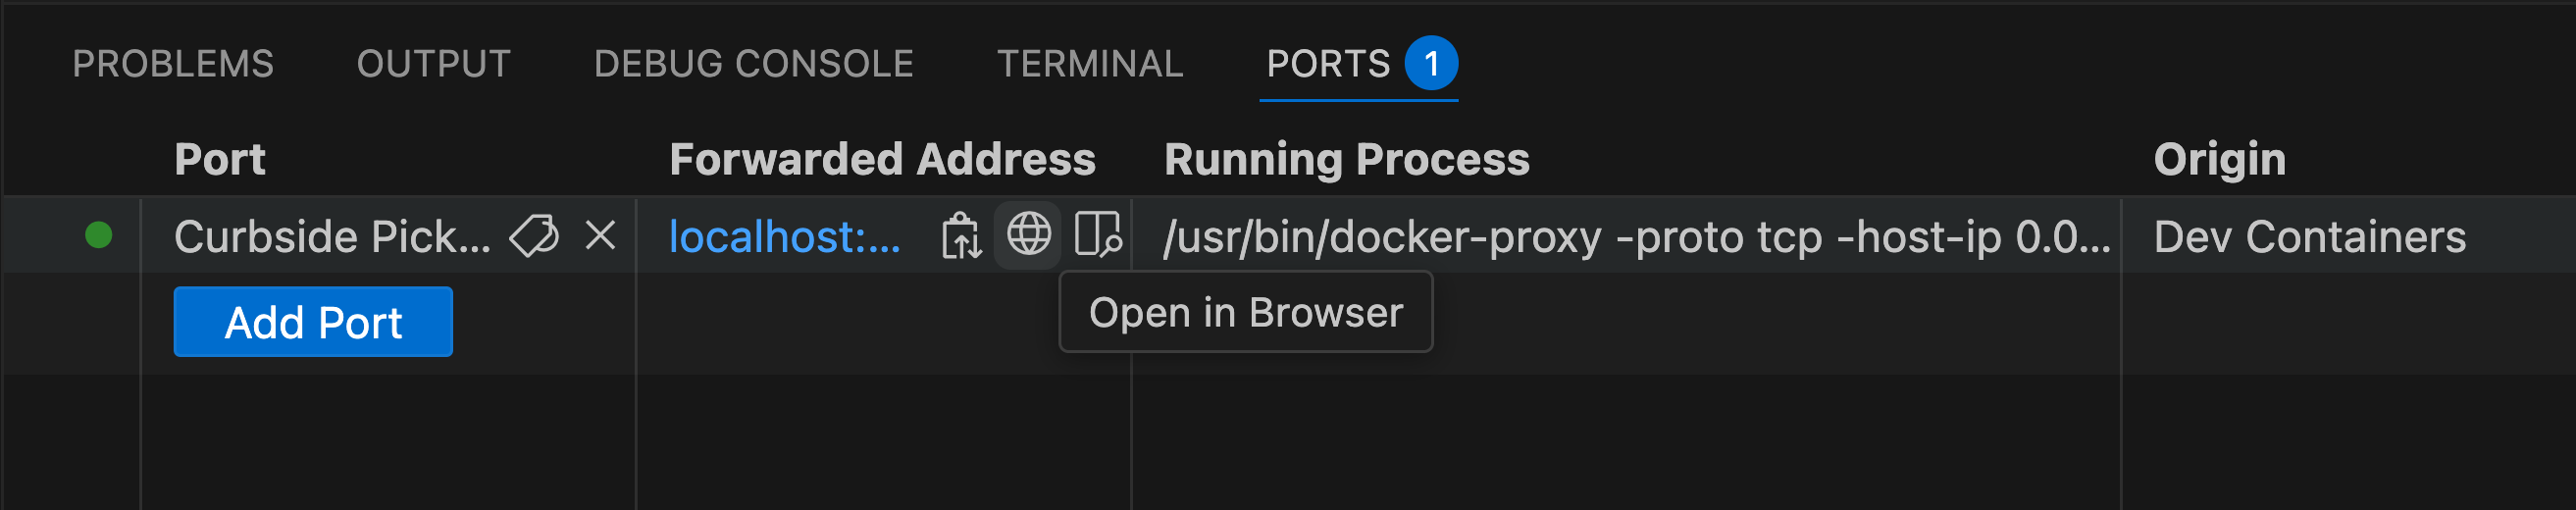
This will open up a URL (like http://localhost:8123) in a new tab.
You should see a disconnected demo page like shown below.
Note: This page shows Disconnected because the dashboards have no websocket backend yet. We will use Drasi to deploy a SignalR server which will work as our websocket backend.
🚀 If you’re able to see this, your environment is setup correctly and you can proceed.
👍 The dashboard is still blank because our websocket server is not deployed
⌛️ If your dashboard is not loading, or your codespace wasn’t setup, please try recreating your dev container.
🤨 If you keep running into issues, please reach the Drasi team at our discord channel and share your dev-container creation logs.
You should see a disconnected demo page like shown below.
Note: This page shows Disconnected because the dashboards have no websocket backend yet. We will use Drasi to deploy a SignalR server which will work as our websocket backend.
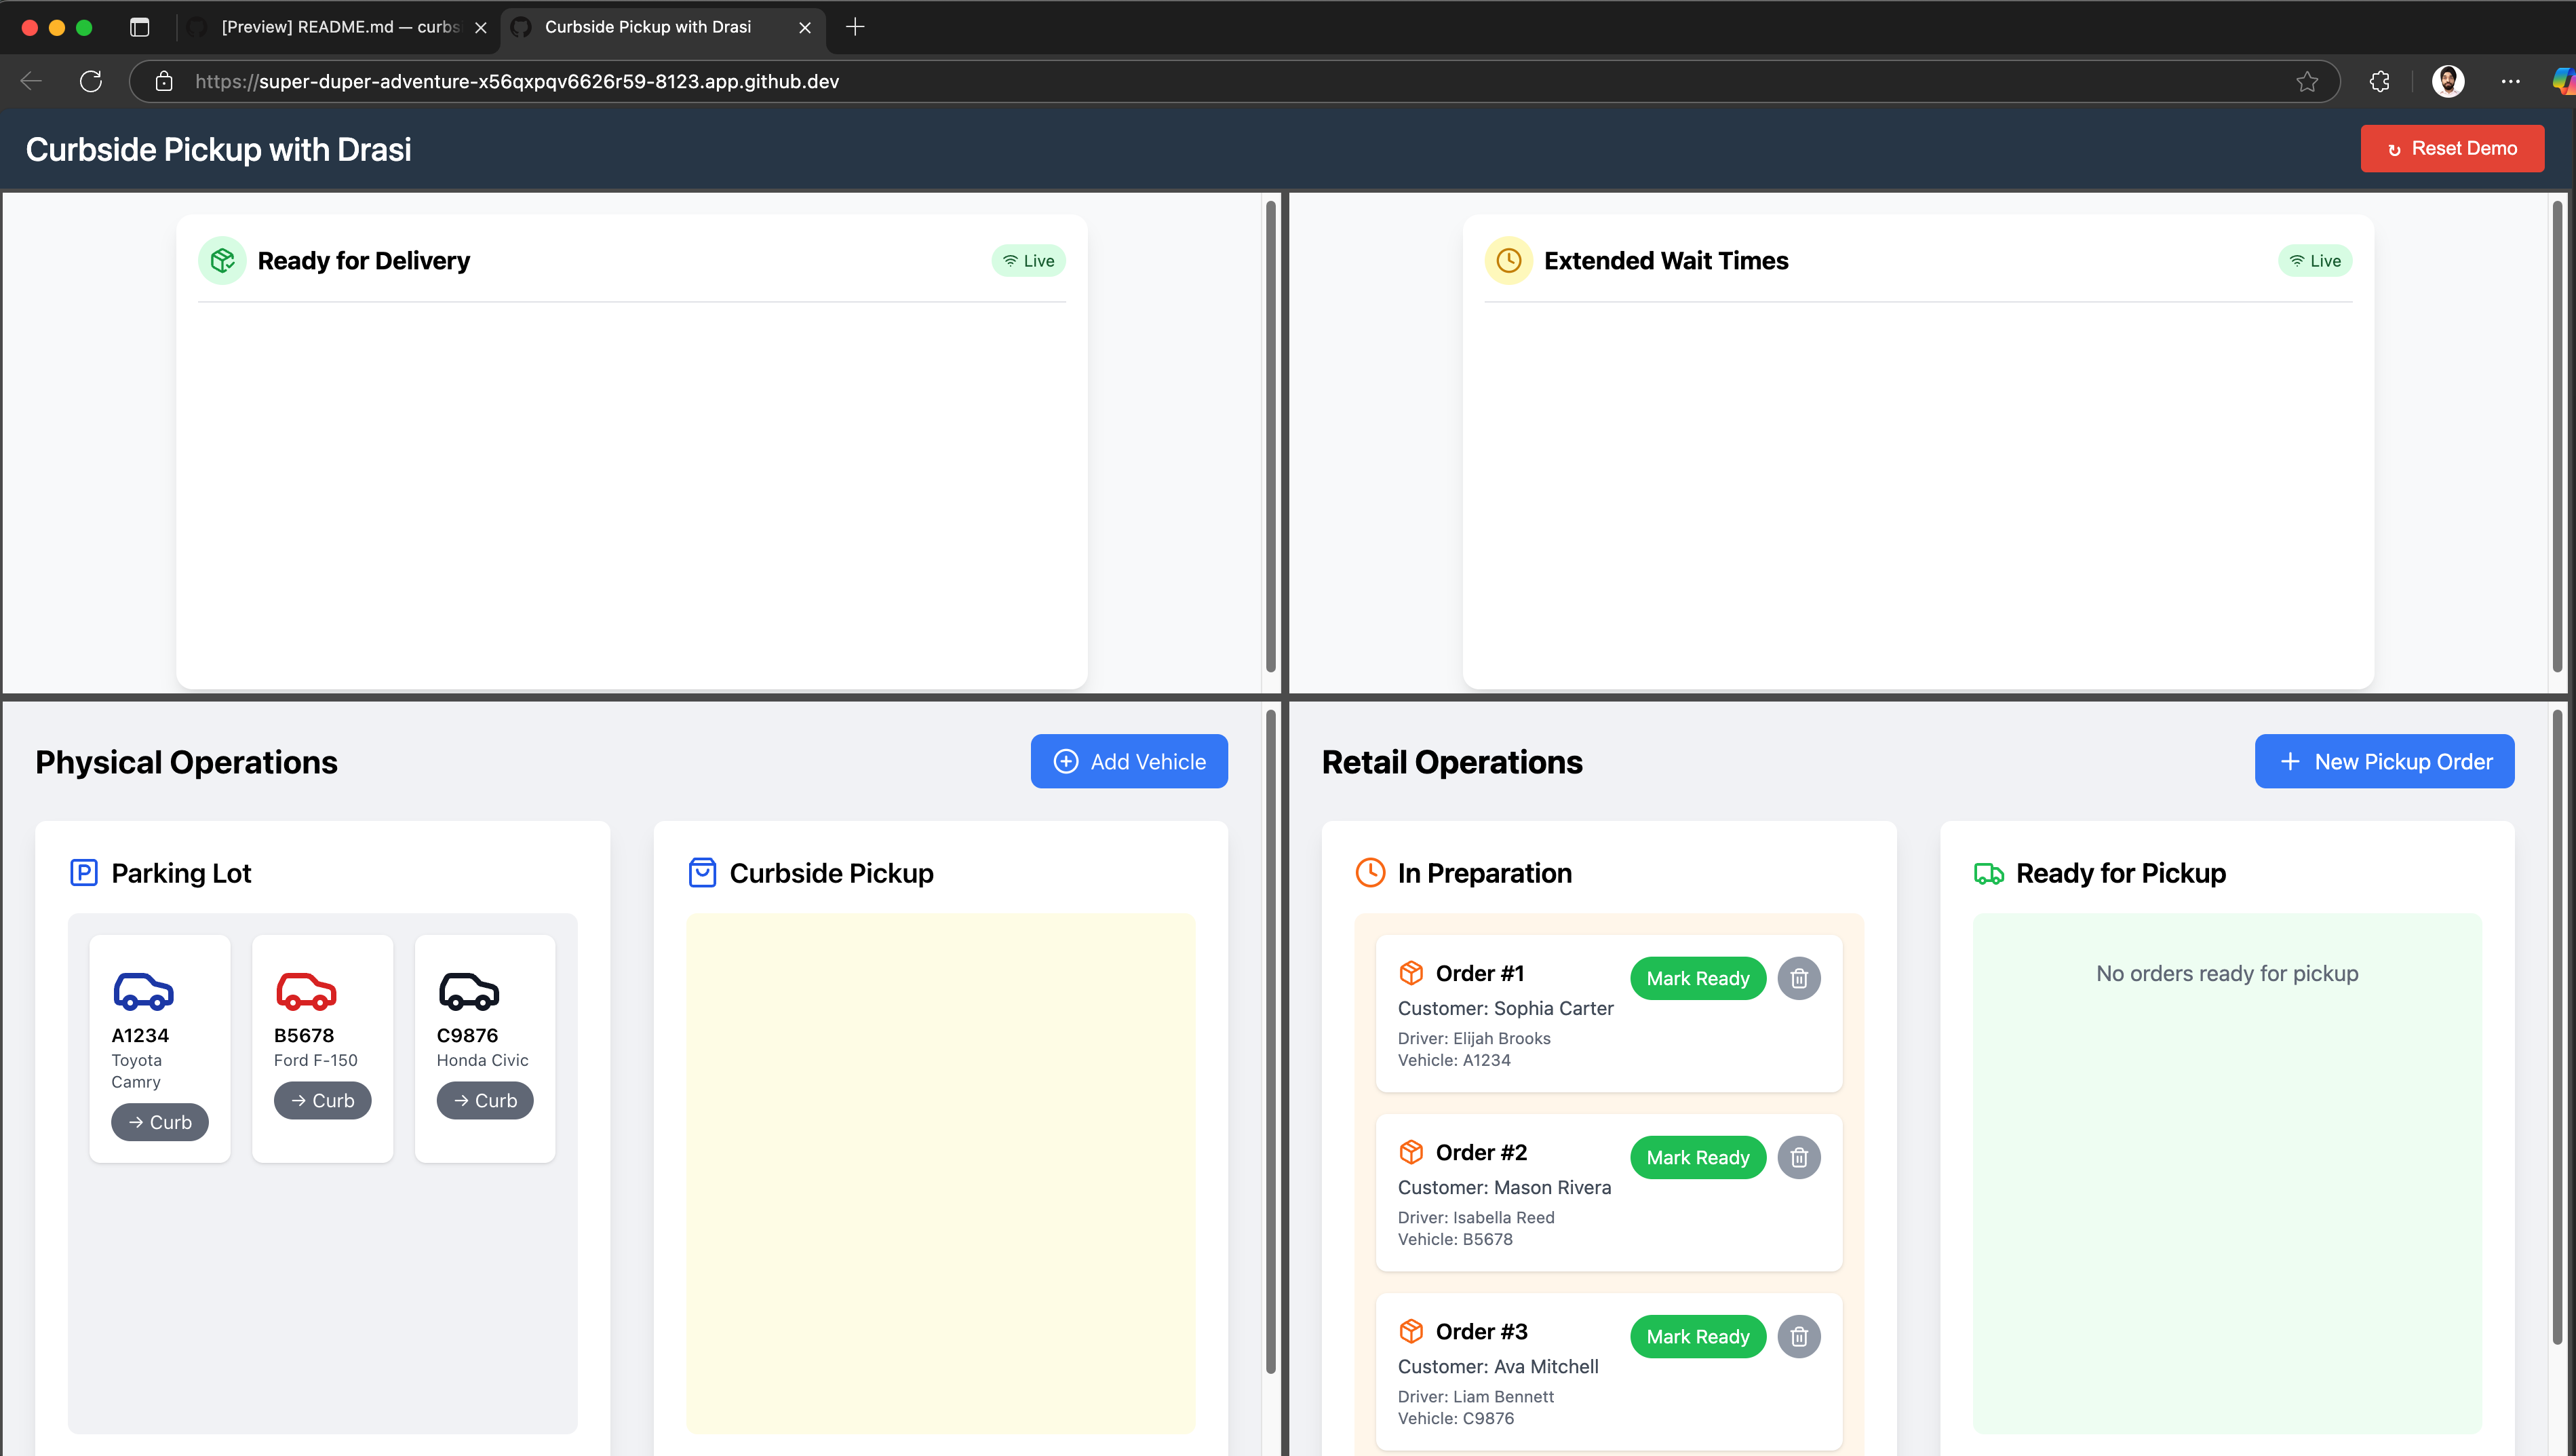
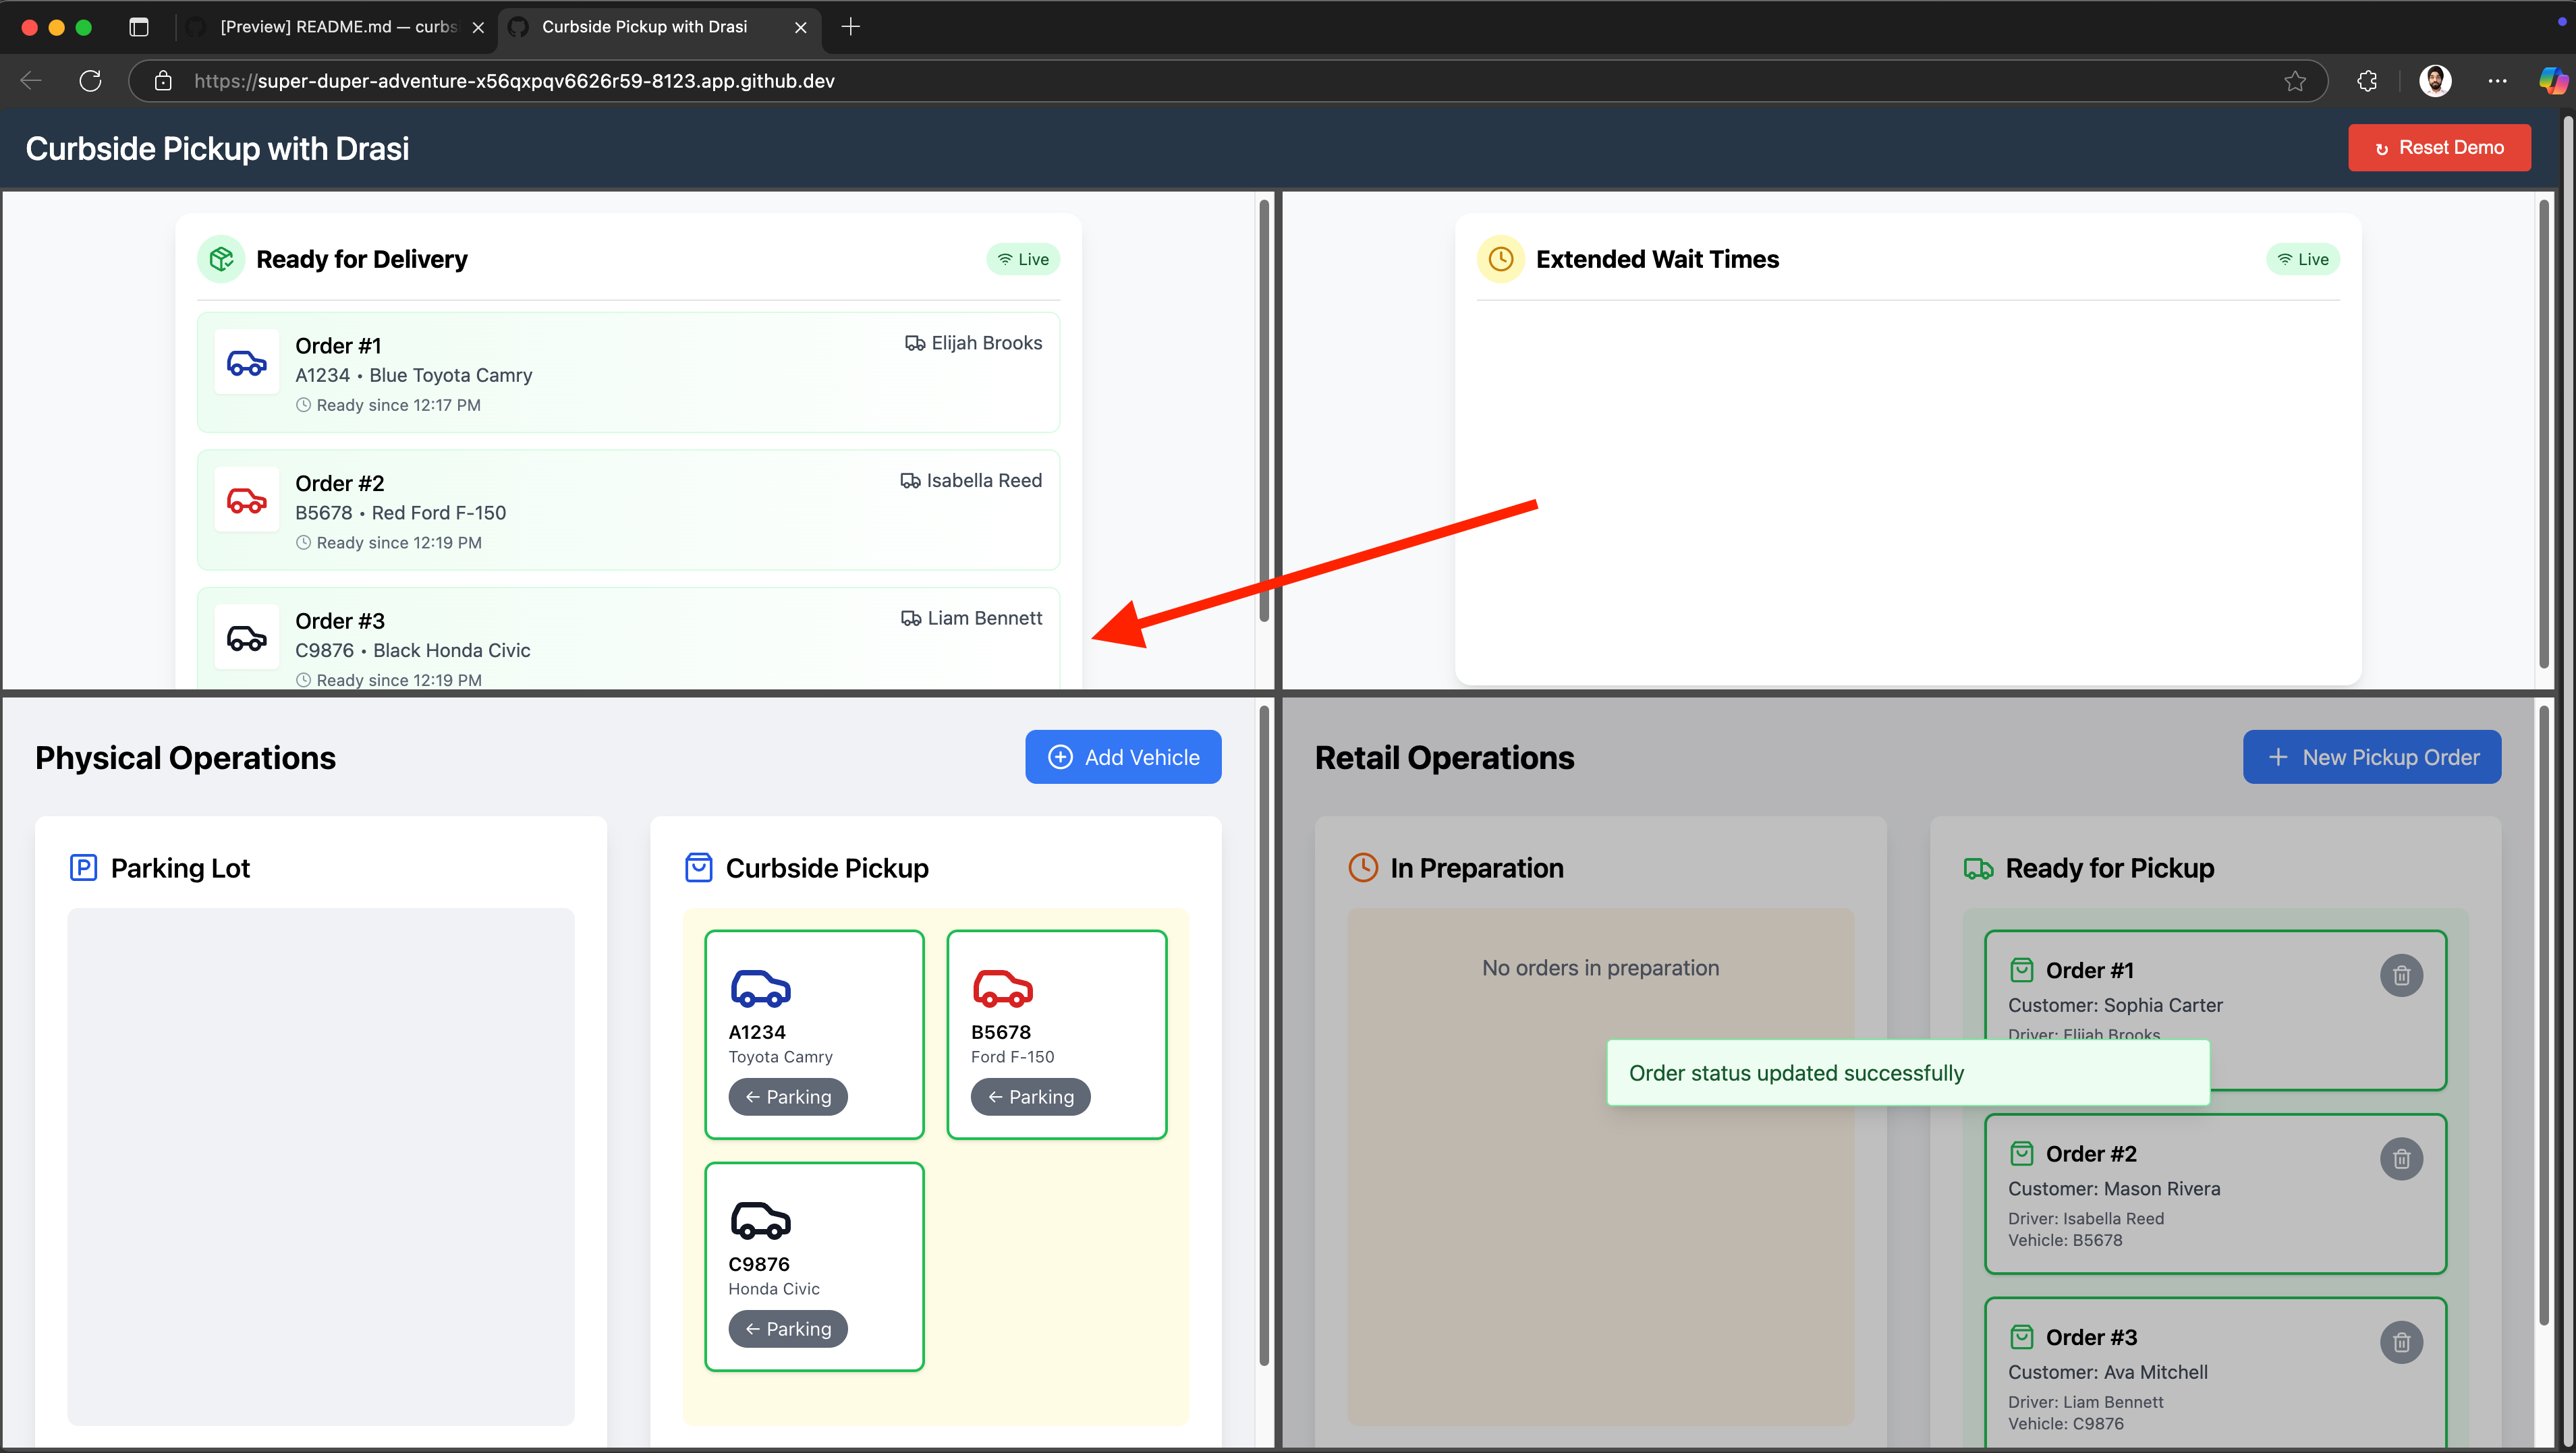
If your environment setup was complete, you should see the demo portal. This demo portal shows all four applications in a 2x2 grid:
- Delivery Dashboard (top-left): Real-time order matching.
- Delay Dashboard (top-right): Identify extended wait times in real time.
- Retail Operations (bottom-right): Simulate order management
- Physical Operations (bottom-left): Simulate vehicle movement
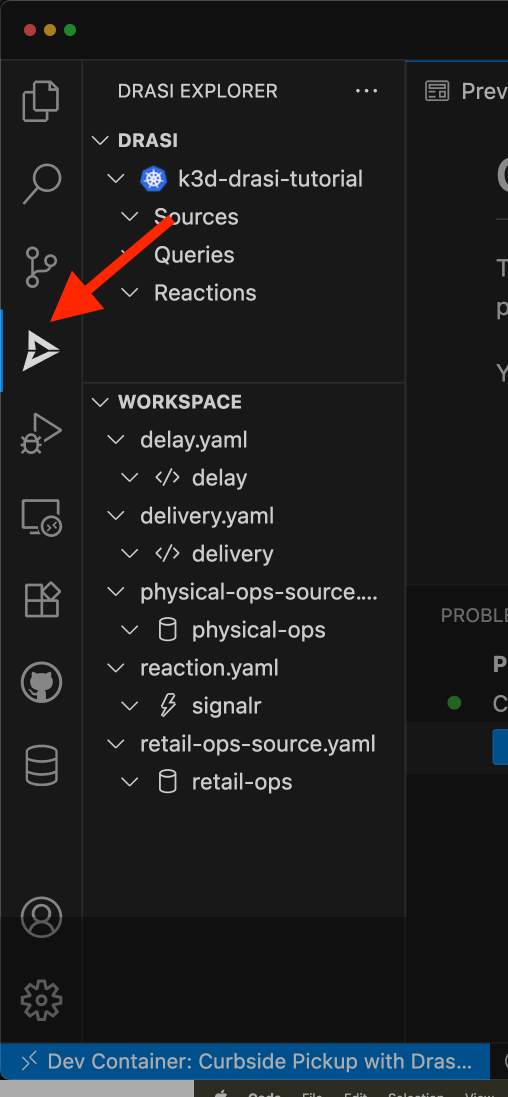
Drasi VSCode Extension
We also have a VSCode extension for Drasi, which can make it easy to debug and deploy Drasi components. Although this is not required, you can use this during our tutorial if you want a terminal-free experience.
Your codespace already has the Drasi extension installed:
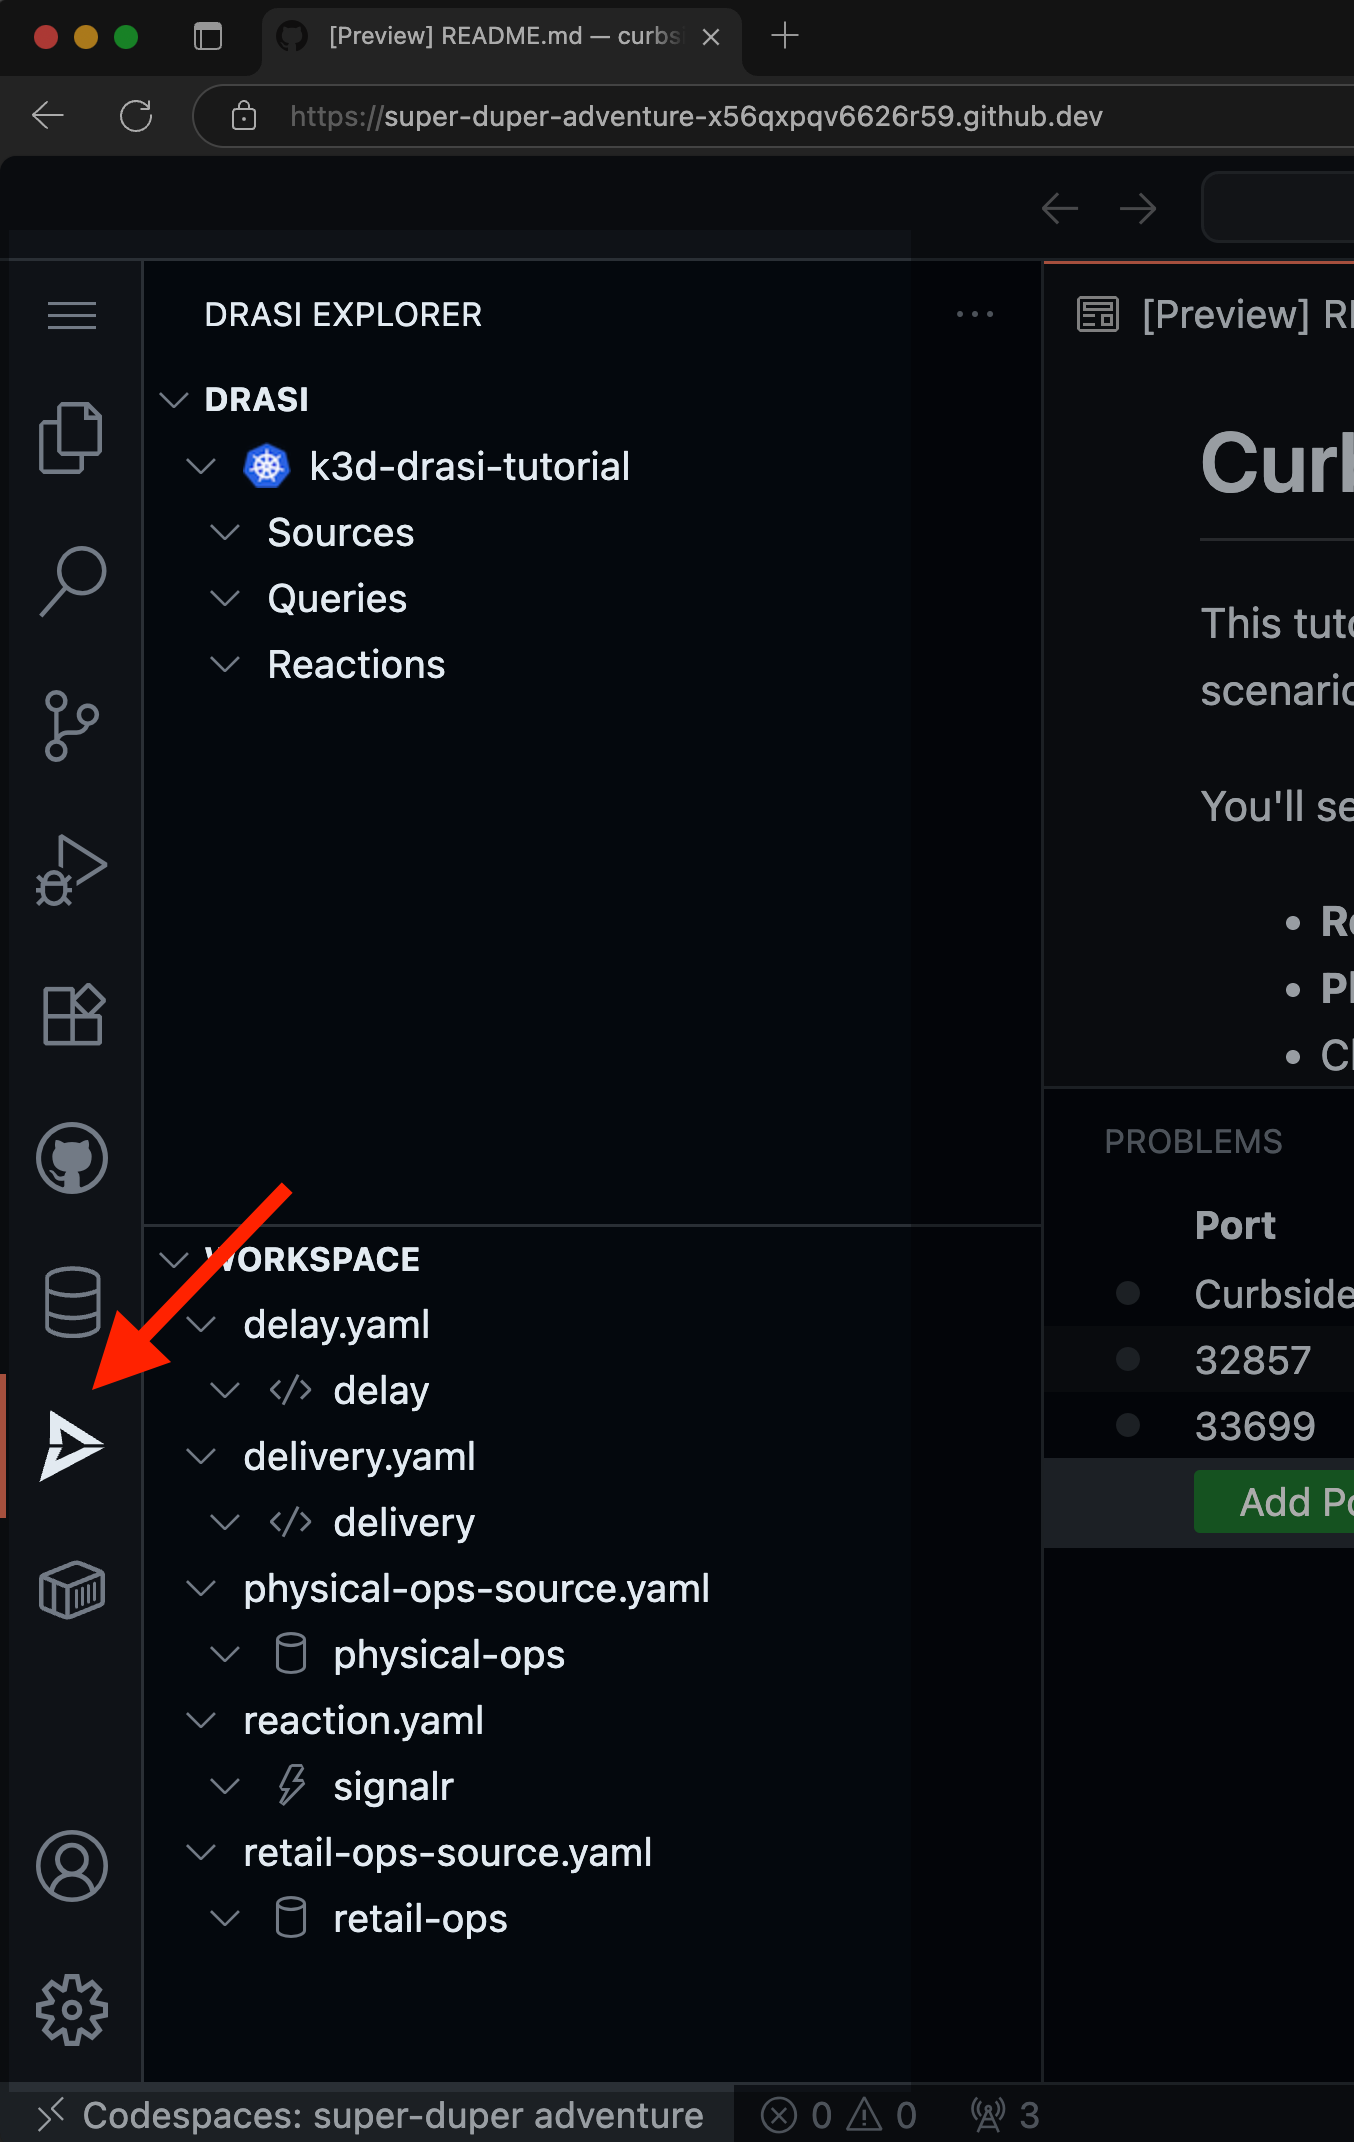
Your dev container already has the Drasi extension installed:
You can install the VSCode Extension by following the instructions here.
Note: If you are using VSCode and installing the extension, it is recommended to open the folder learning/tutorial/curbside-pickup in VSCode.
This is because the extension automatically lists all the Drasi YAMLs found in your workspace and the screenshots in the rest of this tutorial assume the set of YAMLs within the path mentioned earlier. If you have learning or other a different path opened in VSCode, you might see a different set of source, query and reaction YAMLs.
Add Drasi Sources
Sources in Drasi provide connectivity to the data sources and monitor them for change. Learn more about Sources here.
The retail team uses a PostgreSQL database which can be added as a Drasi source.
We have the following YAML in file retail-ops-source.yaml placed in the tutorial/curbside-pickup/drasi directory.
apiVersion: v1
kind: Source
name: retail-ops
spec:
  kind: PostgreSQL
  properties:
    host: postgres.default.svc.cluster.local
    user: test
    port: 5432
    ssl: false
    password: test
    database: RetailOperations
    tables:
      - public.orders
There is a similar source for MySQL database that tracks vehicles in the file physical-ops-source.yaml.
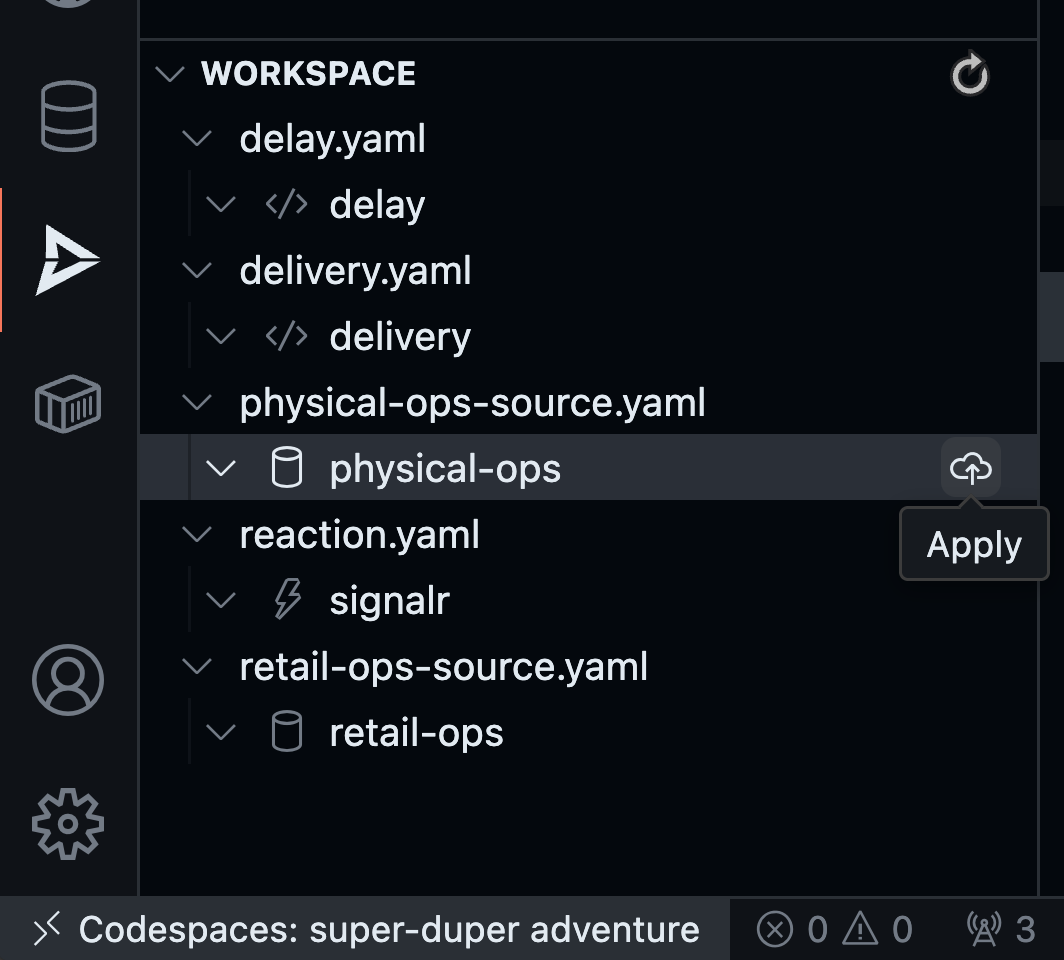
Find the retail-ops source in the Workspace inside Drasi VSCode Extension as shown here, and click “Apply”:
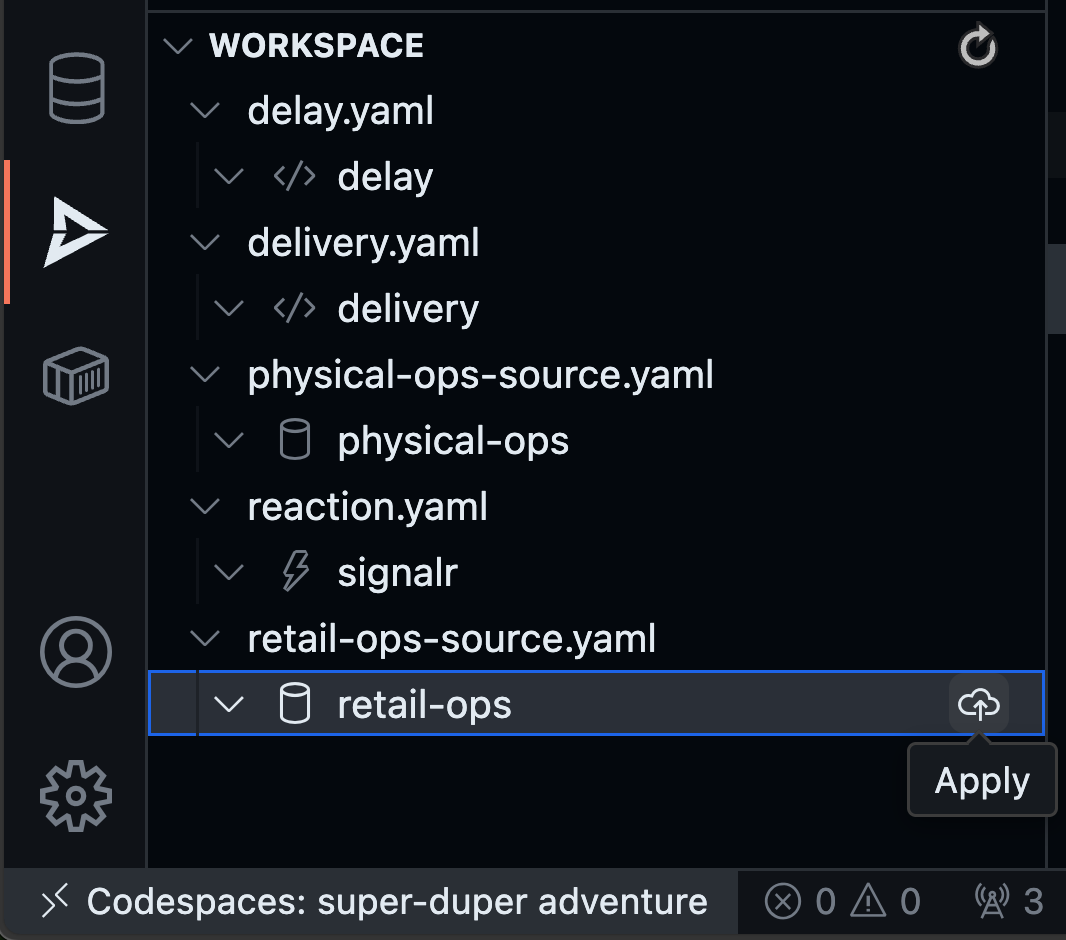
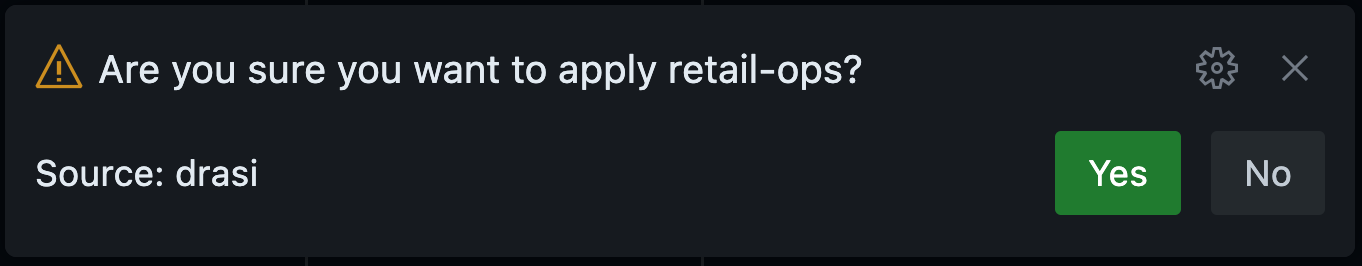
You will get a pop-up on the bottom right corner of your screen. Confirm if you want to deploy the source.
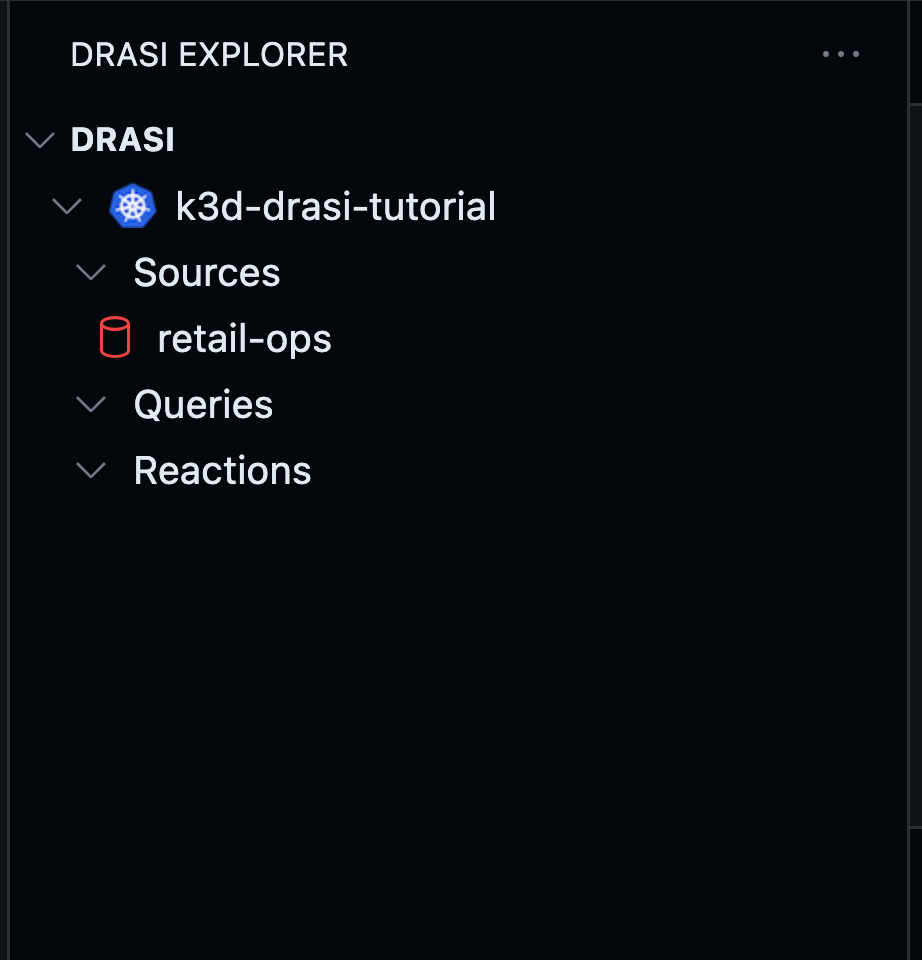
You will see the source with a Red icon - which means we need to wait for few seconds for the source to come online:
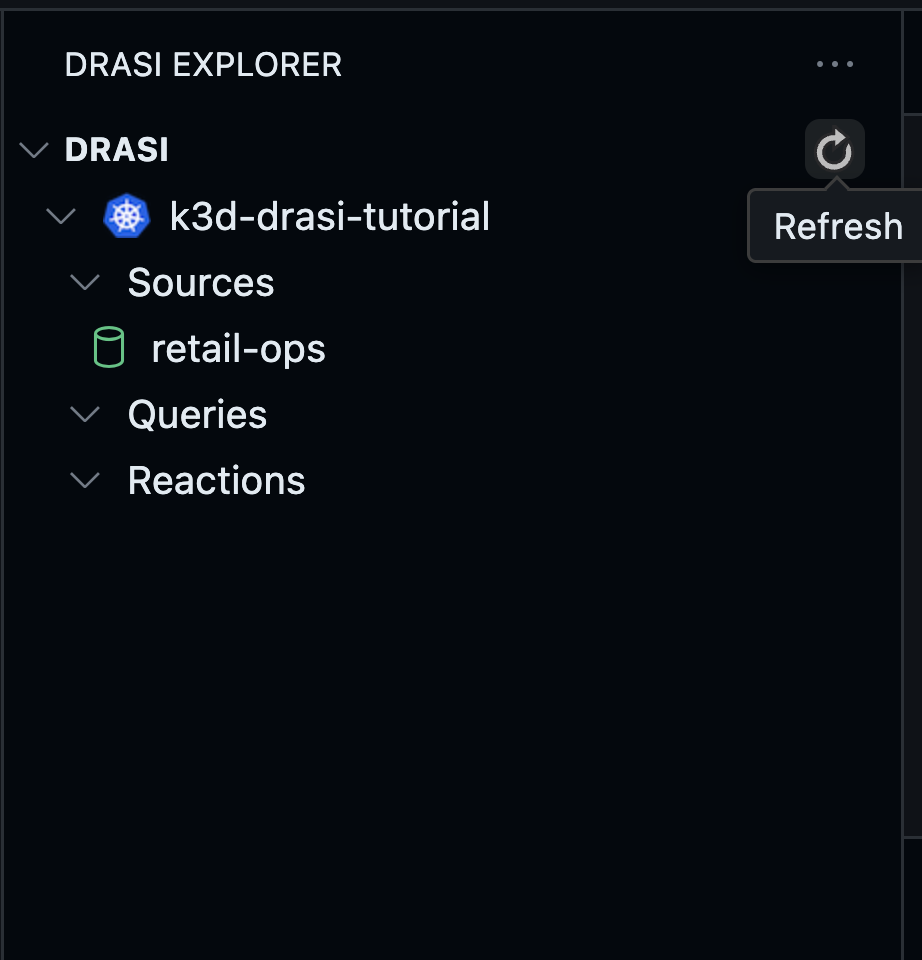
The source will show up with a Green icon when it is ready for use. Try the refresh button shown here if it does not become ready within a couple minutes:
Likewise apply the physical-ops source in the Workspace inside Drasi VSCode Extension as shown here:
Wait for this source to be ready. Once your both sources are ready like this, you can move to the queries:
Open up a terminal and navigate to the drasi directory within your workspace (tutorial/curbside-pickup/drasi):
cd drasi
Use the following commands to apply the PostgreSQL source, and wait for it to come online:
drasi apply -f retail-ops-source.yaml
drasi wait -f retail-ops-source.yaml -t 120
Similarly, apply the MySQL source for physical operations:
drasi apply -f physical-ops-source.yaml
drasi wait -f physical-ops-source.yaml -t 120
Verify both sources are online:
drasi list source
You should see:
      ID       | AVAILABLE | MESSAGES
---------------+-----------+-----------
  retail-ops   | true      |
  physical-ops | true      |
Write Drasi Queries
Continuous Queries are the mechanism by which you tell Drasi what changes to detect in source systems as well as the data you want distributed when changes are detected. You can read more about them here.
Query for matched orders
When writing queries, Drasi allows us to model all of our data coming from disparate heterogeneous systems as a single virtual graph of nodes and relationships. On this graph, we can then write declarative queries.
For example, to match Orders that are Ready with their pickup Vehicles
that are in the Curbside, we can envision a graph of Orders & Vehicles
connected by a relation Pickup-By which connects an order to a vehicle.
(More on how Drasi makes this connection is explained later).
We can then write the following Cypher-style query:
MATCH (o:orders)-[:PICKUP_BY]->(v:vehicles)
    WHERE o.status = 'ready'
      AND v.location = 'Curbside'
    RETURN
      o.id AS orderId,
      o.status AS orderStatus,
      o.driver_name AS driverName,
      o.plate as vehicleId,
      v.make as vehicleMake,
      v.model as vehicleModel,
      v.color as vehicleColor,
      v.location as vehicleLocation
Since we are creating a mock scenario, and our database may have entries where the matched orders may exist at epoch (time = 0), we filter that out as we want to report the timestamp when the order becomes ready.
We can filter out the orders that were already matched by adding to WHERE
like:
WHERE o.status = 'ready'
  AND v.location = 'Curbside'
  AND drasi.changeDateTime(v) != datetime({epochMillis: 0})
  AND drasi.changeDateTime(o) != datetime({epochMillis: 0})
And we can include the following in our projected result to report the timestamp when the orders got matched to the drivers:
RETURN
  o.id AS orderId,
  ....
  ....
  drasi.listMax([drasi.changeDateTime(o), drasi.changeDateTime(v)]) as readyTimestamp
The above does a max as we want to report when a match happened, which occurs
when both the driver location becomes Curbside and order status becomes
Ready. Therefore, we need the greater of the change timestamp among both.
Synthetic Relationships
Note that in our Cypher query we want to relate the orders with their
respective vehicles, even though the entities live in different databases.
This is achieved by modeling the relationship as a synthetic relationship
called PICKUP_BY which is defined in the joins section of the YAML below.
This joins section tells Drasi how to stitch together a graph
of entities and relationships across arbitrary heterogeneous data sources.
To be able to create that virtualized graph, we need to tell Drasi how to connect vehicles to orders. In our example, we can do that by Vehicle plate number which is present in both databases.
Following is the complete YAML file for the continuous query that shows how the
synthetic relationship is defined. Pay attention to the joins section:
# Returns the orders ready for delivery
kind: ContinuousQuery
apiVersion: v1
name: delivery
spec:
  mode: query
  sources:
    subscriptions:
      - id: physical-ops
        nodes:
          - sourceLabel: vehicles
      - id: retail-ops
        nodes:
          - sourceLabel: orders
    joins:
      - id: PICKUP_BY
        keys:
          - label: vehicles
            property: plate
          - label: orders
            property: plate
  query: >
    MATCH (o:orders)-[:PICKUP_BY]->(v:vehicles)
    WHERE o.status = 'ready'
      AND v.location = 'Curbside'
      AND drasi.changeDateTime(v) != datetime({epochMillis: 0})
      AND drasi.changeDateTime(o) != datetime({epochMillis: 0})
    RETURN
      o.id AS orderId,
      o.status AS orderStatus,
      o.driver_name AS driverName,
      o.plate as vehicleId,
      v.make as vehicleMake,
      v.model as vehicleModel,
      v.color as vehicleColor,
      v.location as vehicleLocation,
      drasi.listMax([drasi.changeDateTime(o), drasi.changeDateTime(v)]) as readyTimestamp
This full YAML file is located at curbside-pickup/drasi/delivery.yaml.
Query for extended wait times
Drasi has a unique ability to react to not only events but also the lack of events, or non-events, for a given query. This means Drasi can watch a the result-set of a continuous query and if the required conditions are not met for the specified interval, it can signal reactions.
We can use these temporal capabilities of Drasi to write a Cypher query that
will report Orders that are In Progress, but the driver has been waiting
to pick it up on the curbside for 10 seconds or more.
For this, we can write the following query:
MATCH (o:orders)-[:PICKUP_BY]->(v:vehicles)
WHERE o.status != 'ready'
WITH
  o, v,
  drasi.changeDateTime(v) AS waitingSinceTimestamp
WHERE
  waitingSinceTimestamp != datetime({epochMillis: 0}) AND
  drasi.trueFor(v.location = 'Curbside', duration ({ seconds: 10 }))
RETURN
  o.id AS orderId,
  o.customer_name as customerName,
  waitingSinceTimestamp
In the query above, we only match those vehicles for which orders are not ready
by filtering with WHERE o.status != 'ready'. Now, we want to find vehicles
whose location was set to Curbside 10+ seconds ago, while the order was
still not ready. This is achieved by:
drasi.trueFor(v.location = 'Curbside', duration ({ seconds: 10 }))
Here we utilize the future function drasi.trueFor which evaluates whether a
boolean expression remains true for at least a period of time, starting from
the time when the change being evaluated occurred.
Read more about trueFor and other future functions here.
For our mock scenario, when we launch the apps some vehicles may already be
at curbside at the beginning (epoch), and to filter those out we use this:
WHERE waitingSinceTimestamp != datetime({epochMillis: 0}).
The full YAML for this query is present in the file
curbside-pickup/drasi/delay.yaml.
Deploy the queries
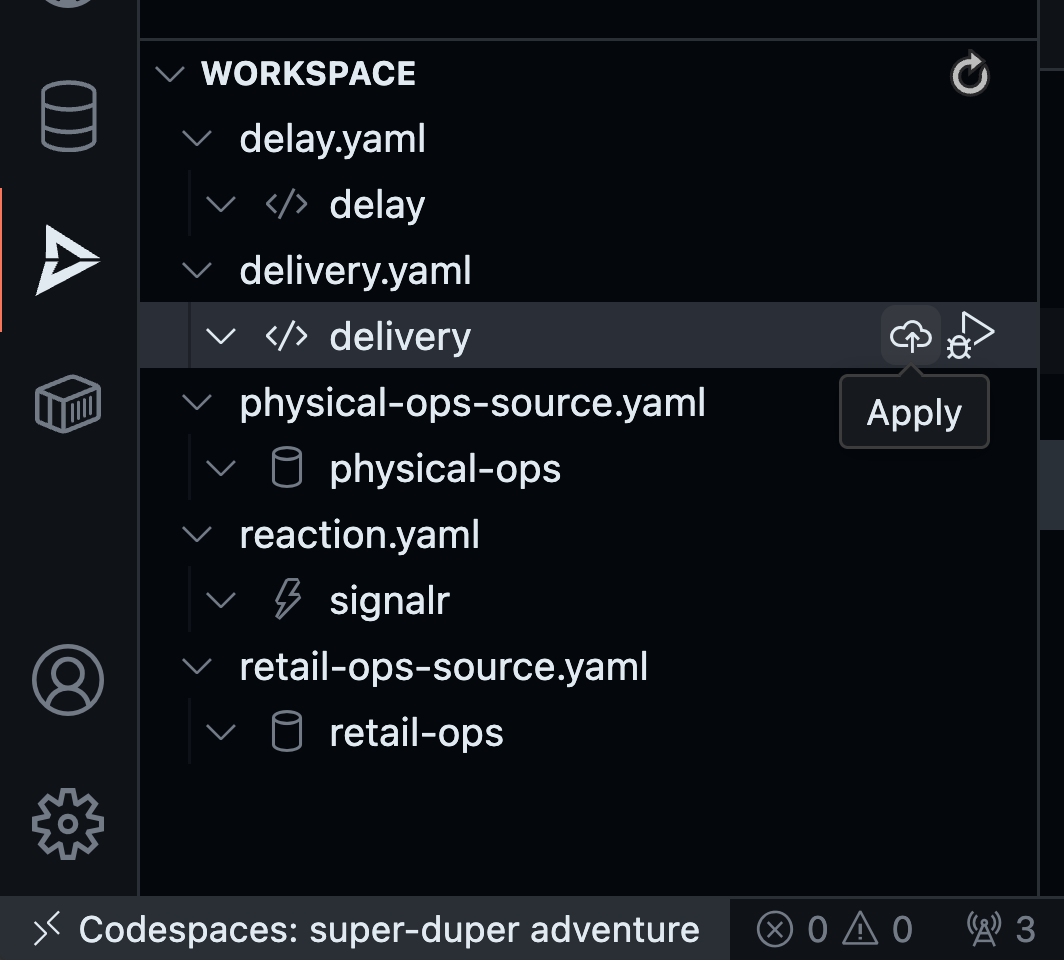
Find the delivery query in the workspace inside Drasi VSCode Extension as shown here, and click “Apply”:
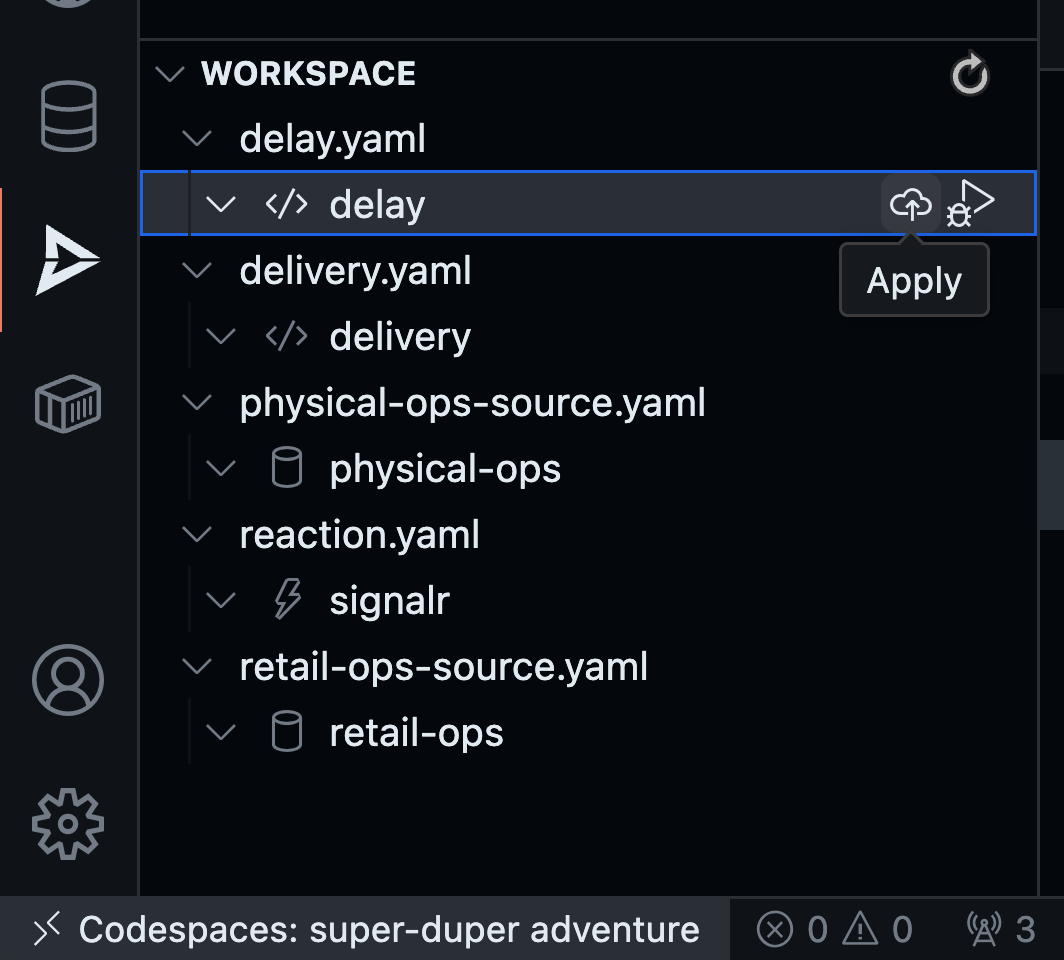
Similarly apply the delay query from the extension:
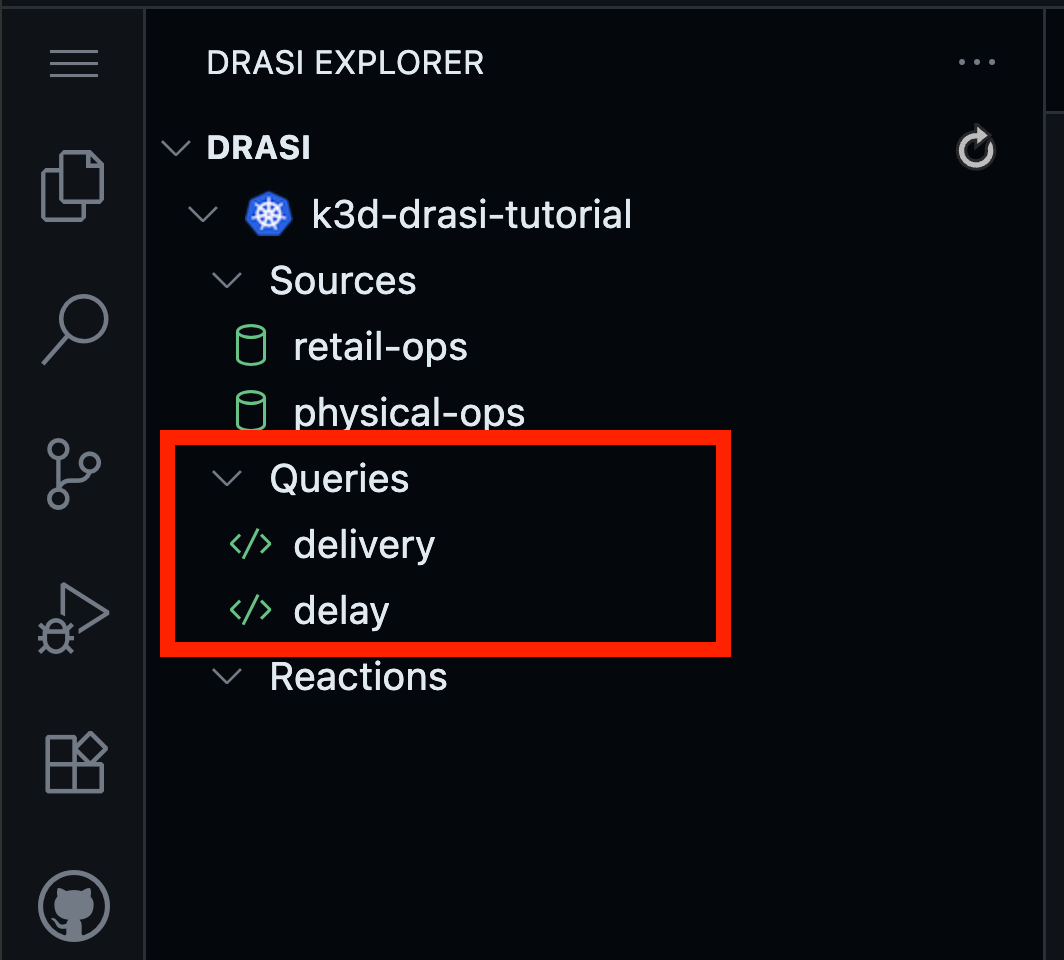
Wait for both queries to be Ready. This will be indicated by both turning Green like this:
Use the command below to apply the first query:
drasi apply -f delivery.yaml
To check the status, use the command:
drasi list query
The STATUS should be Running, and there should be nothing in the column
ERRORMESSAGE.
     ID    | CONTAINER | ERRORMESSAGE |              HOSTNAME        | STATUS
-----------+-----------+--------------+------------------------------+----------
  delivery | default   |              | default-query-host-xxxx-xxxx | Running
Use the command below to apply the second query:
drasi apply -f delay.yaml
To check the status, use the command:
drasi list query
The STATUS should be Running, and there should be nothing in the column
ERRORMESSAGE.
     ID    | CONTAINER | ERRORMESSAGE |              HOSTNAME        | STATUS
-----------+-----------+--------------+------------------------------+----------
  delivery | default   |              | default-query-host-xxxx-xxxx | Running
  delay    | default   |              | default-query-host-xxxx-xxxx | Running
Drasi SignalR Reaction
Reactions process the stream of query result changes output by one or more Drasi Queries and act on them. You can read more about Reactions here.
To implement a reactive dashboard, we can use any number of frameworks, and we would need something that can host a websocket for bidirectional communication with the frontend. This should also reliably fall back to ServerSentEvents (SSE) or long polling, ensuring broad support across different network and client configurations. One could use libraries like SignalR, Sockets.IO, Django Channels.
Drasi has a reaction for SignalR available. This simplifies the process, as a
simple YAML configuration enables a SignalR hub to push updates from any
Drasi query to the UI. Following is the config located in curbside-pickup/drasi
directory that lists the queries we’re interested in exposing:
apiVersion: v1
kind: Reaction
name: signalr
spec:
  kind: SignalR
  queries:
    delivery:
    delay:
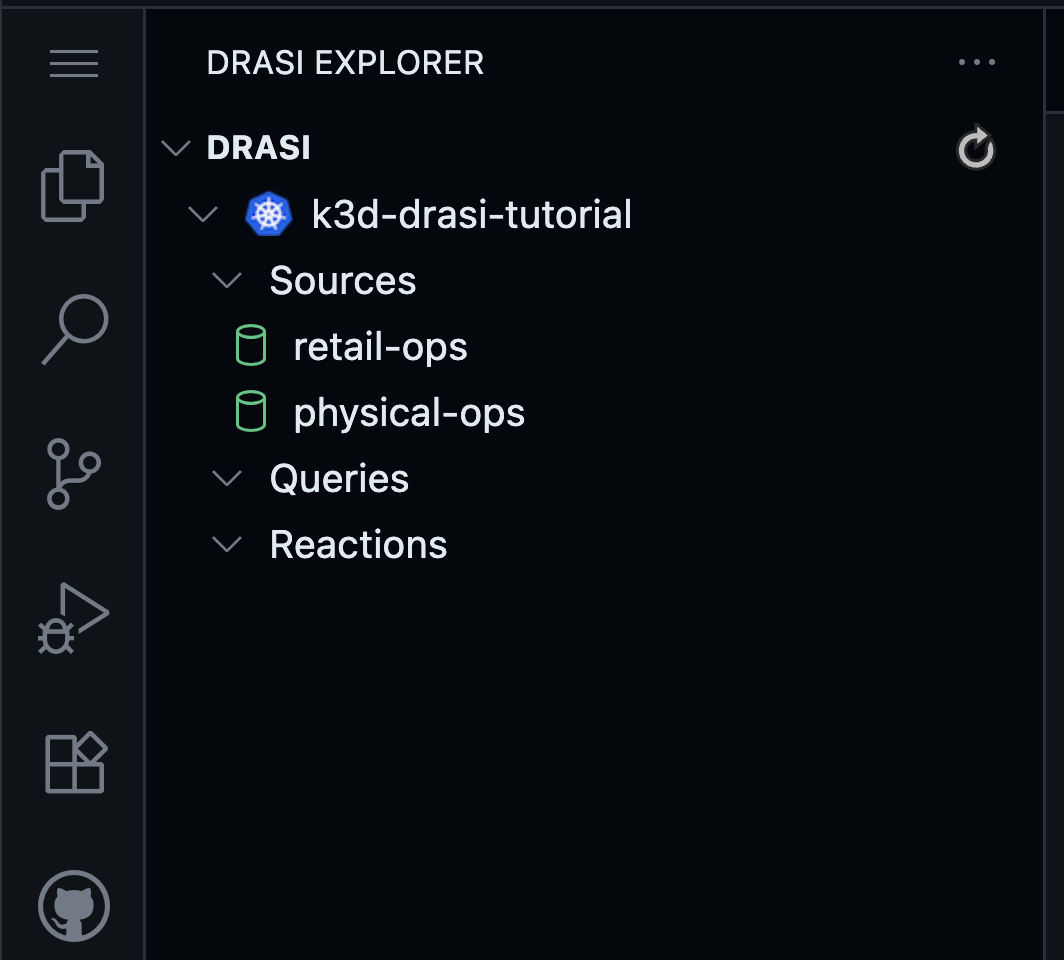
Find the reaction in the Workspace inside Drasi VSCode Extension as shown here, and click “Apply”:
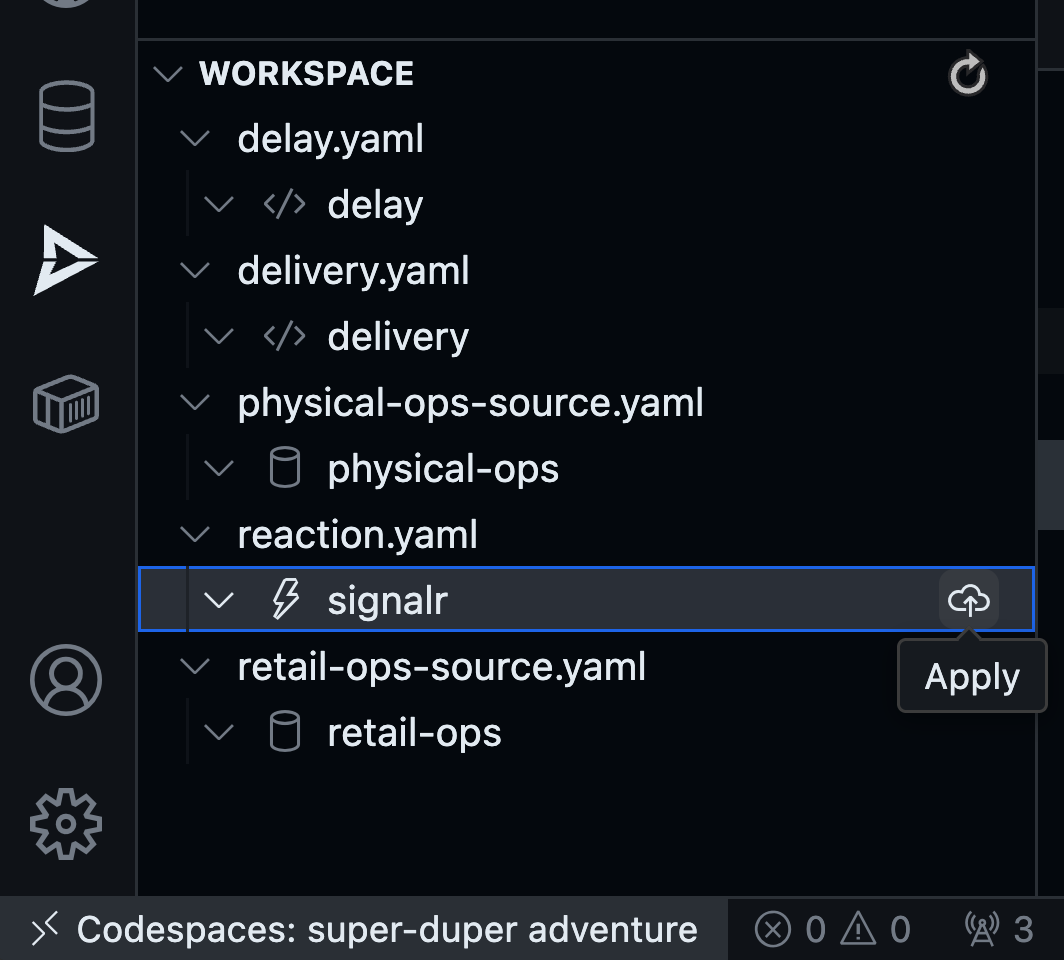
You will notice the reaction deploying. The red icon means that it is not ready yet. Wait for the reaction to get fully deployed.
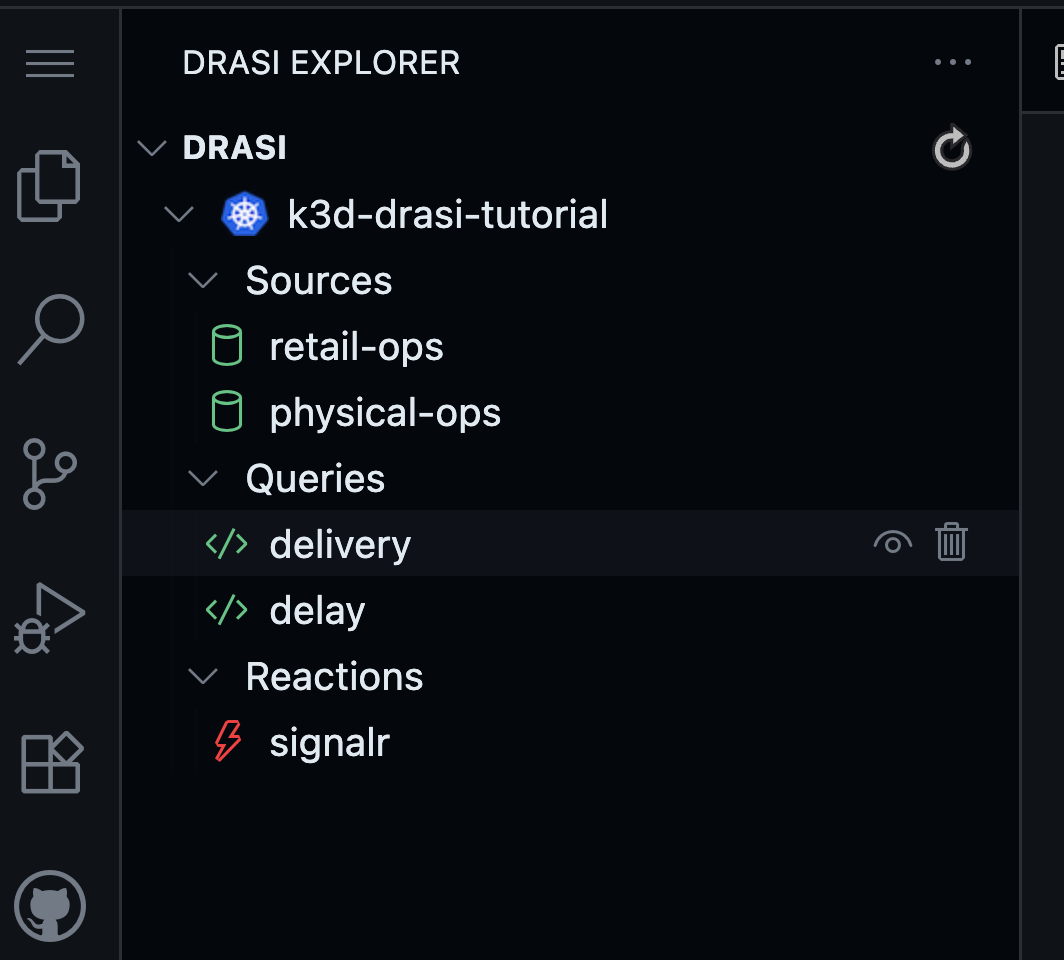
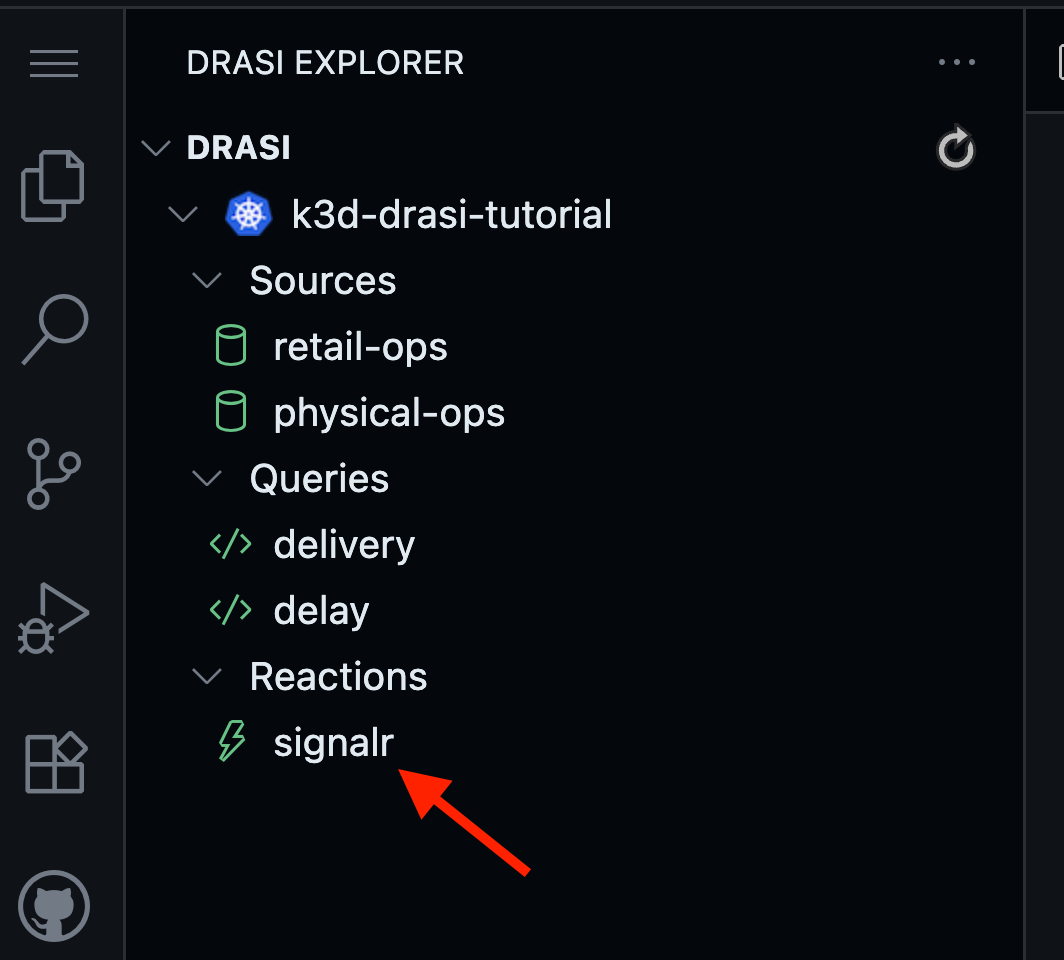
Once the reaction is ready, the icon will turn green like this:
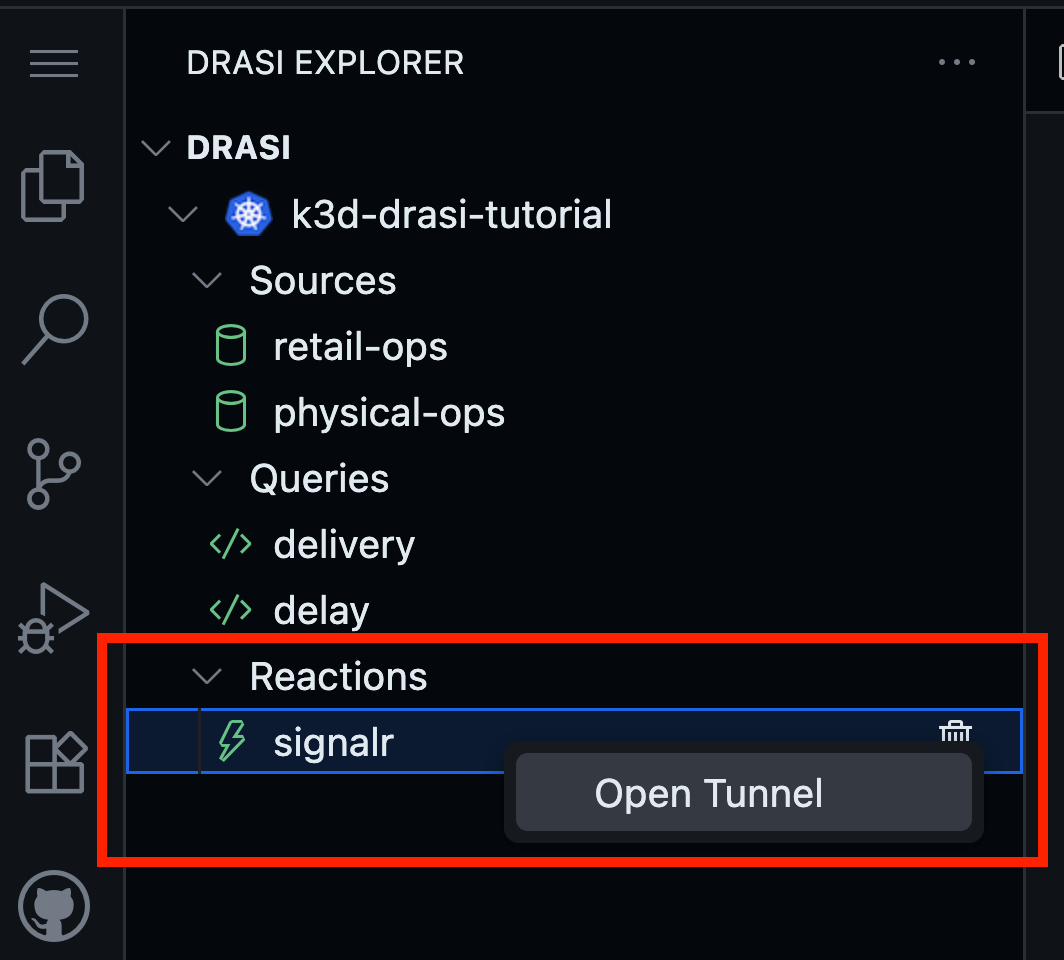
Now you have a websocket server up & running inside the Drasi Cluster. Since our frontend dashboard will be running on localhost, we need to create a tunnel. For this, Right Click on the reaction and select Open Tunnel as shown here:
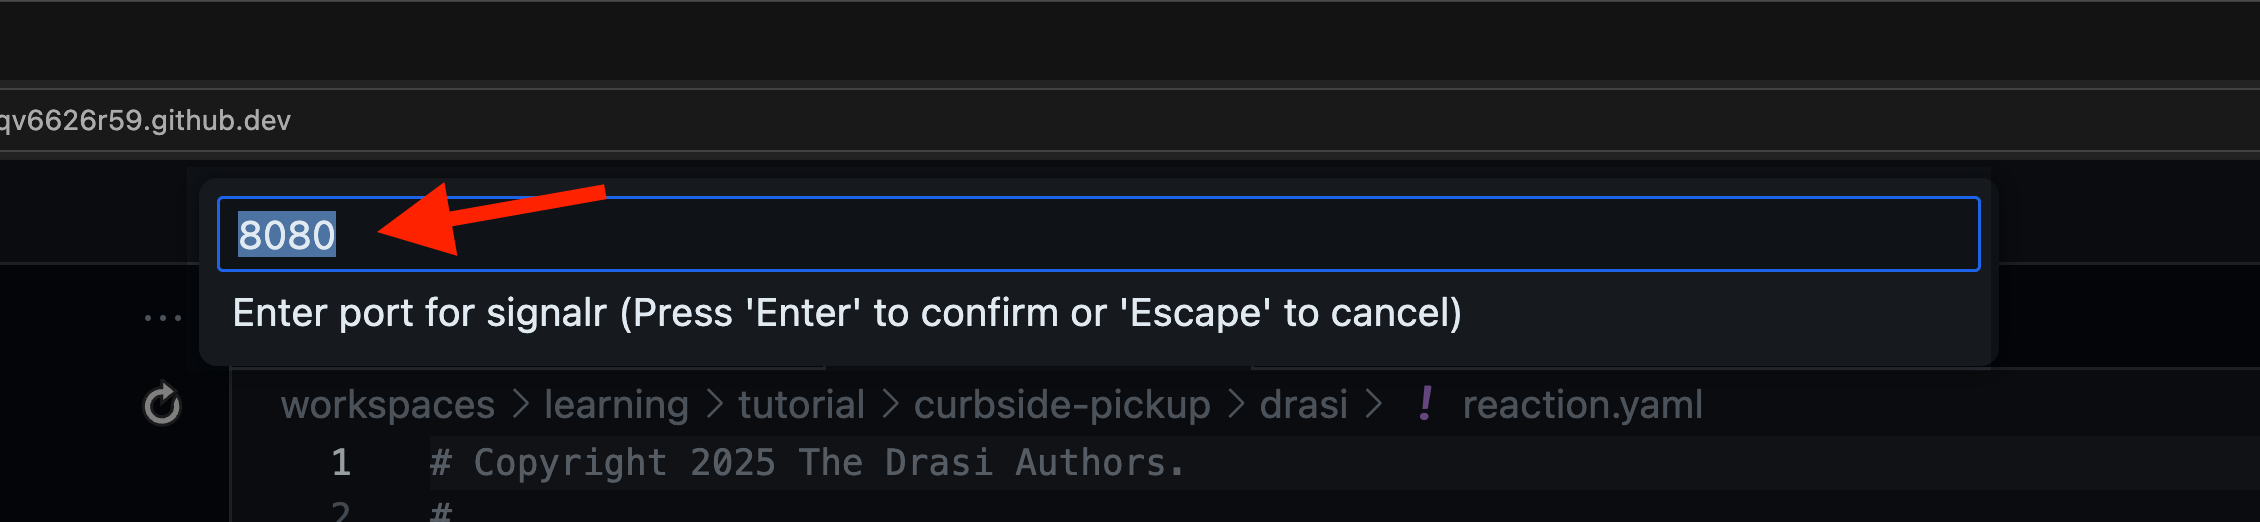
You will get a prompt to specify the port number. We have setup the dashboard to expect signalR hub at port 8080. Therefore, please set the value as 8080 here as shown here:
In the terminal where you’re in directory curbside-pickup/drasi, run the following
commands to have a SignalR Reaction deployed to your Drasi instance.
drasi apply -f reaction.yaml
You can expect the following response:
✓ Apply: Reaction/signalr: complete
Note that reactions might take some time to come up. You can use the following convenient command to wait for it (up to 120 seconds) to come up:
drasi wait -f reaction.yaml -t 120
Once a reaction is online you should be able to see it like so:
drasi list reaction
Following should be the output with nothing in the ‘Messages’ column:
    ID    | AVAILABLE | MESSAGES
----------+-----------+-----------
  signalr | true      |
Now you have a websocket server up & running inside the Drasi Cluster. Since our frontend dashboard will be running on localhost, we need to create a tunnel. Use the following long-running command to create a tunnel. Note: Keep this running, as long as you want the dashboard to be live.
drasi tunnel reaction signalr 8080
Troubleshooting the reaction
Following commands can be used on the terminal to troubleshoot the reaction.
Check messages in output of drasi list reaction.
For more details you can also use
drasi describe reaction signalr.
Check the logs of pods created for the services signalr-gateway.
These are deployed under drasi’s namespace (default: drasi-system) in your
kubernetes cluster. You should also investigate the logs of the pods
created for source which will have names like signalr-xxxxx-xxxx.
Port Forwarding
Drasi is running inside a k3d cluster inside your github codespaces container.
The Drasi tunnel for SignalR reaction has made the port accessible inside the codespace at port 8080.
The dashboard will however run your local browser. Github codespaces automatically would have forwarded port 8080.
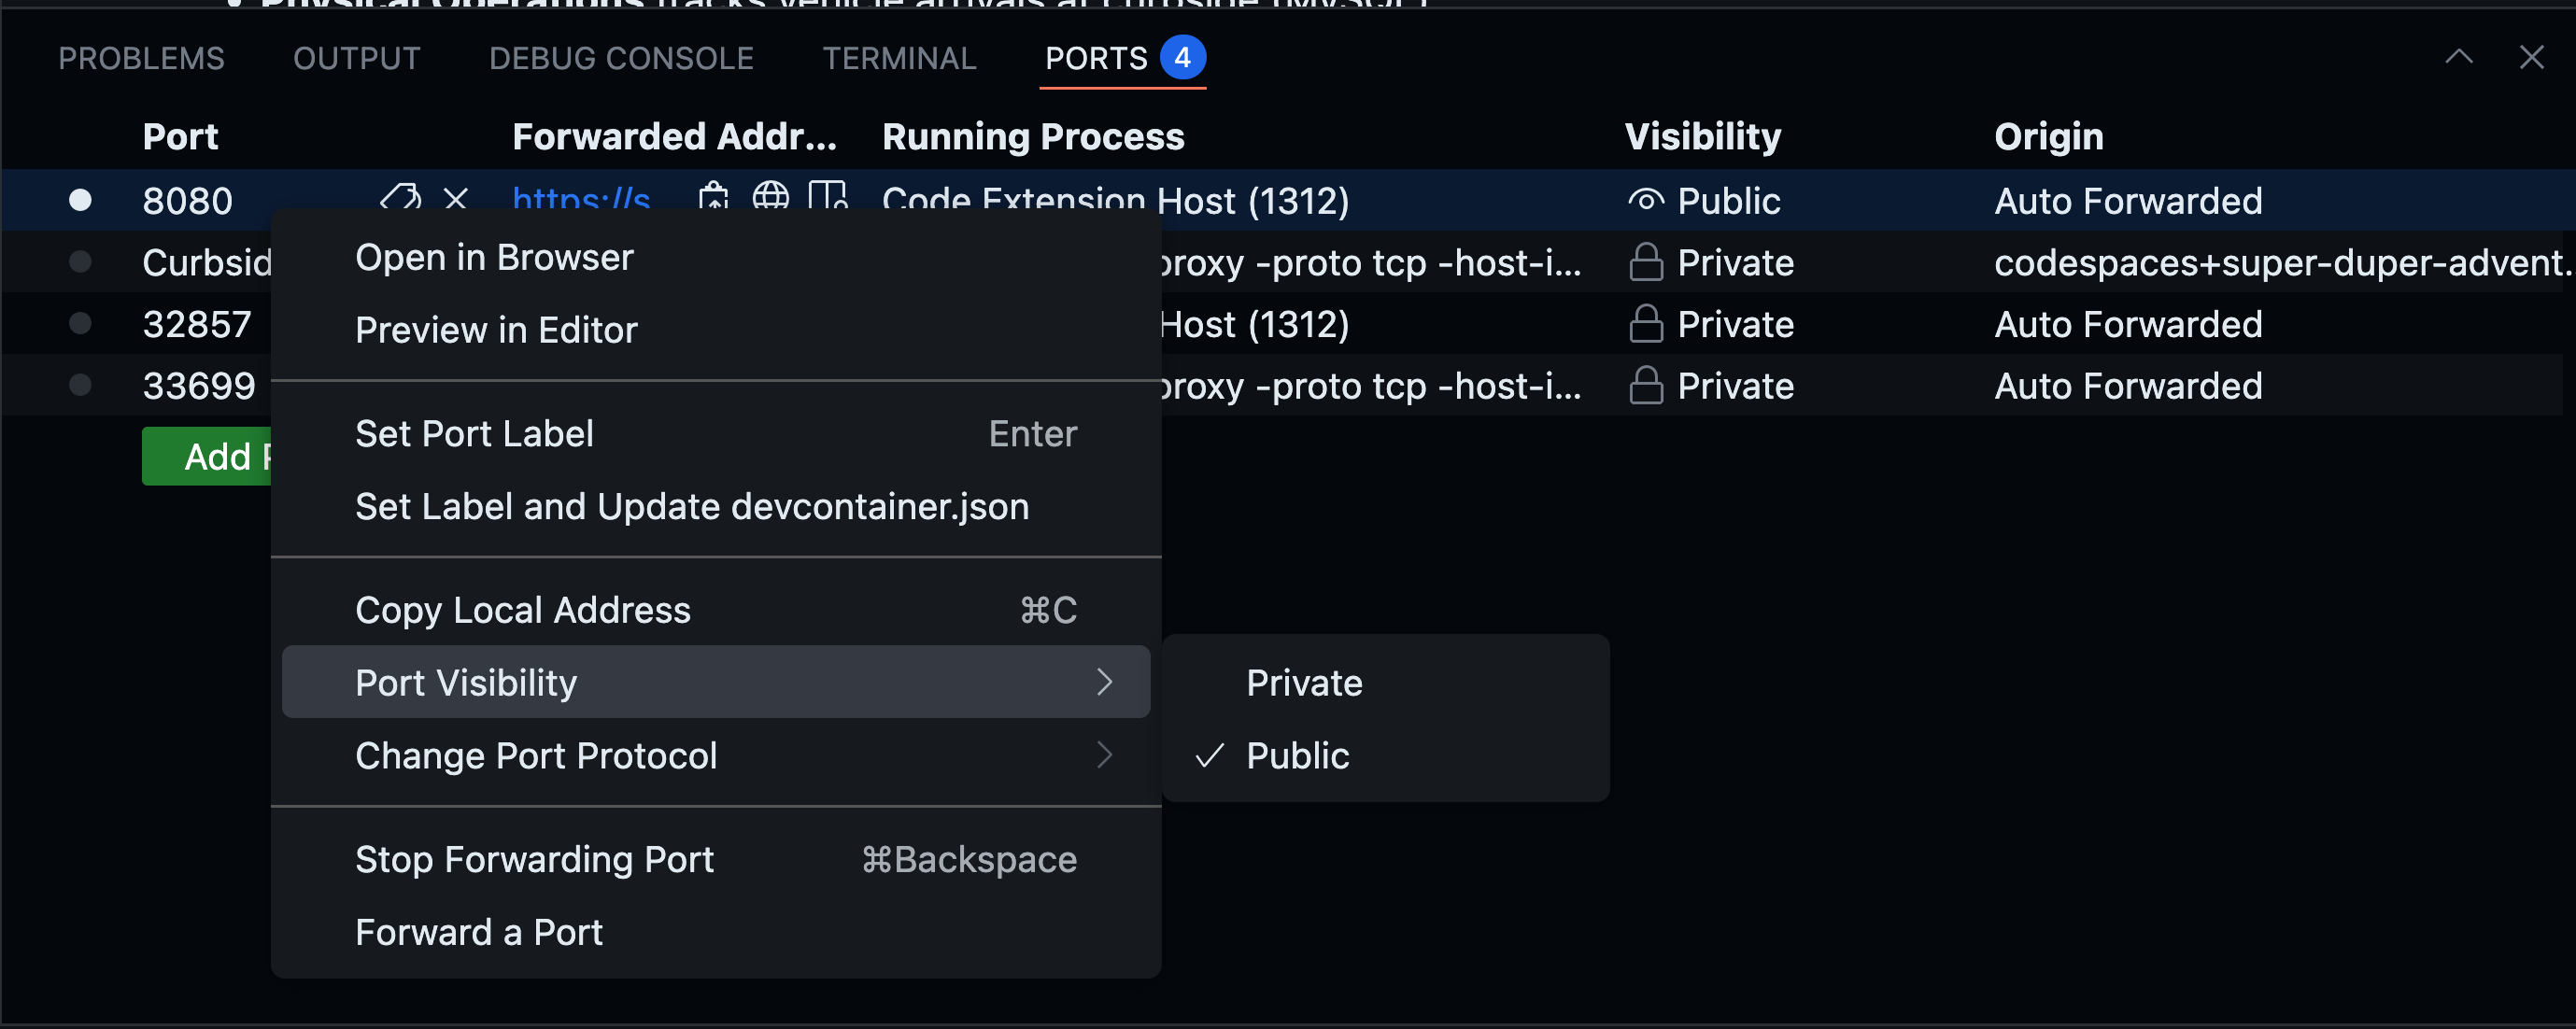
Note: Please make the port visibility as public:
- Go to the PORTS tab in VS Code and Right click on port 8080
- Select Port Visibility
- Mark it as public
- Make sure that the port is marked as Public.
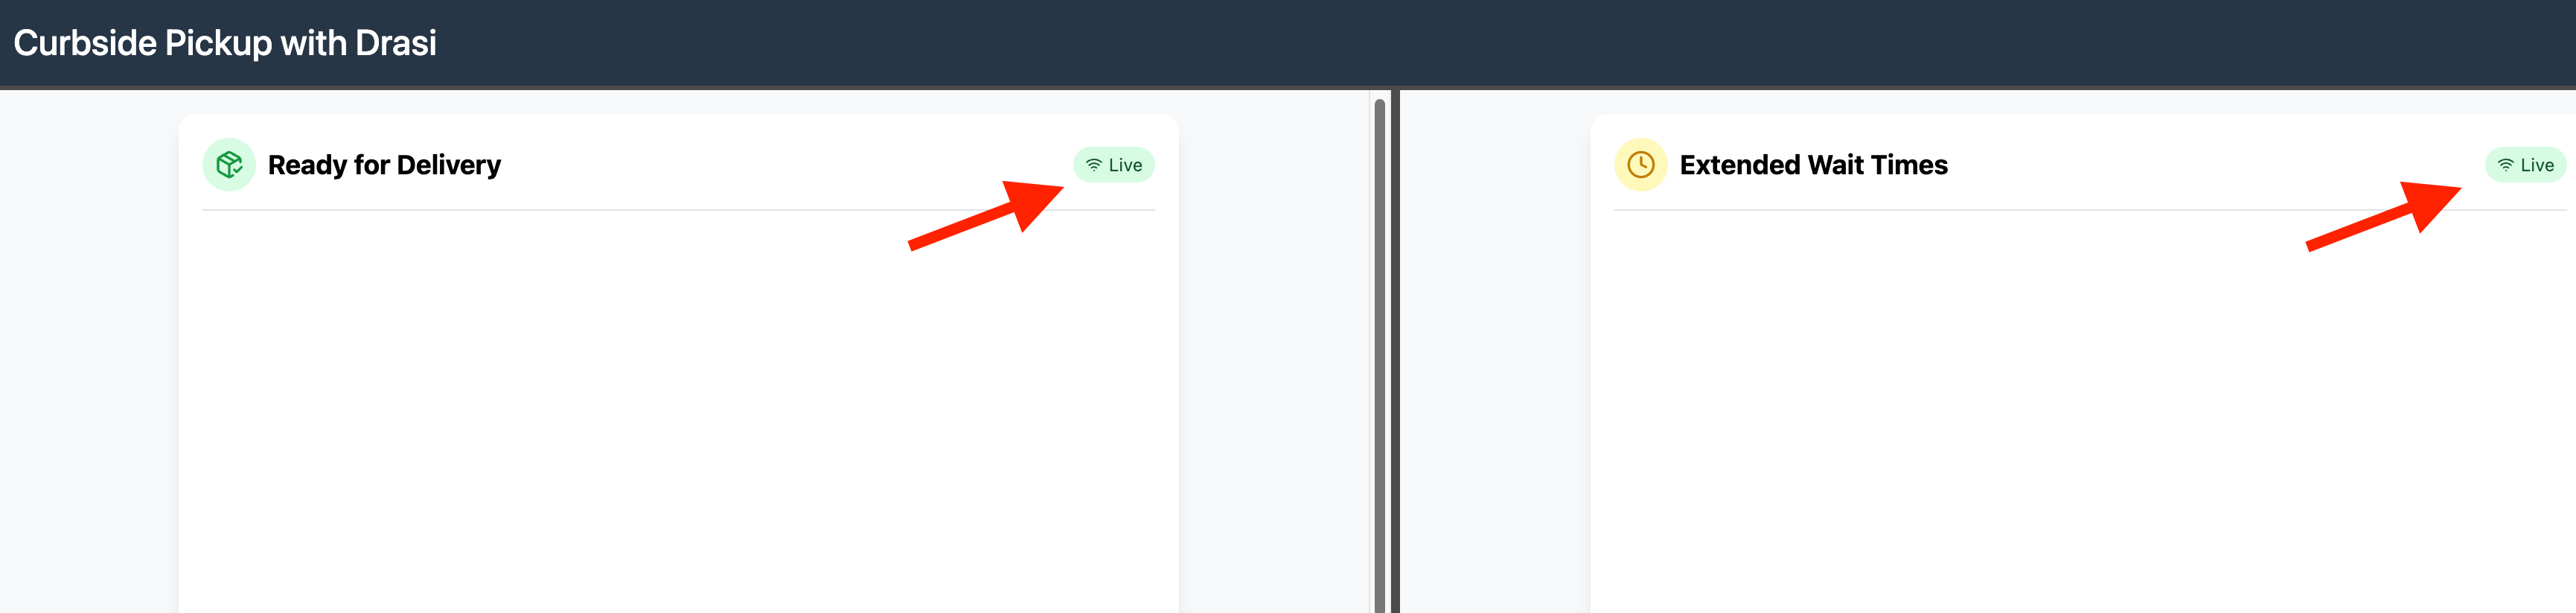
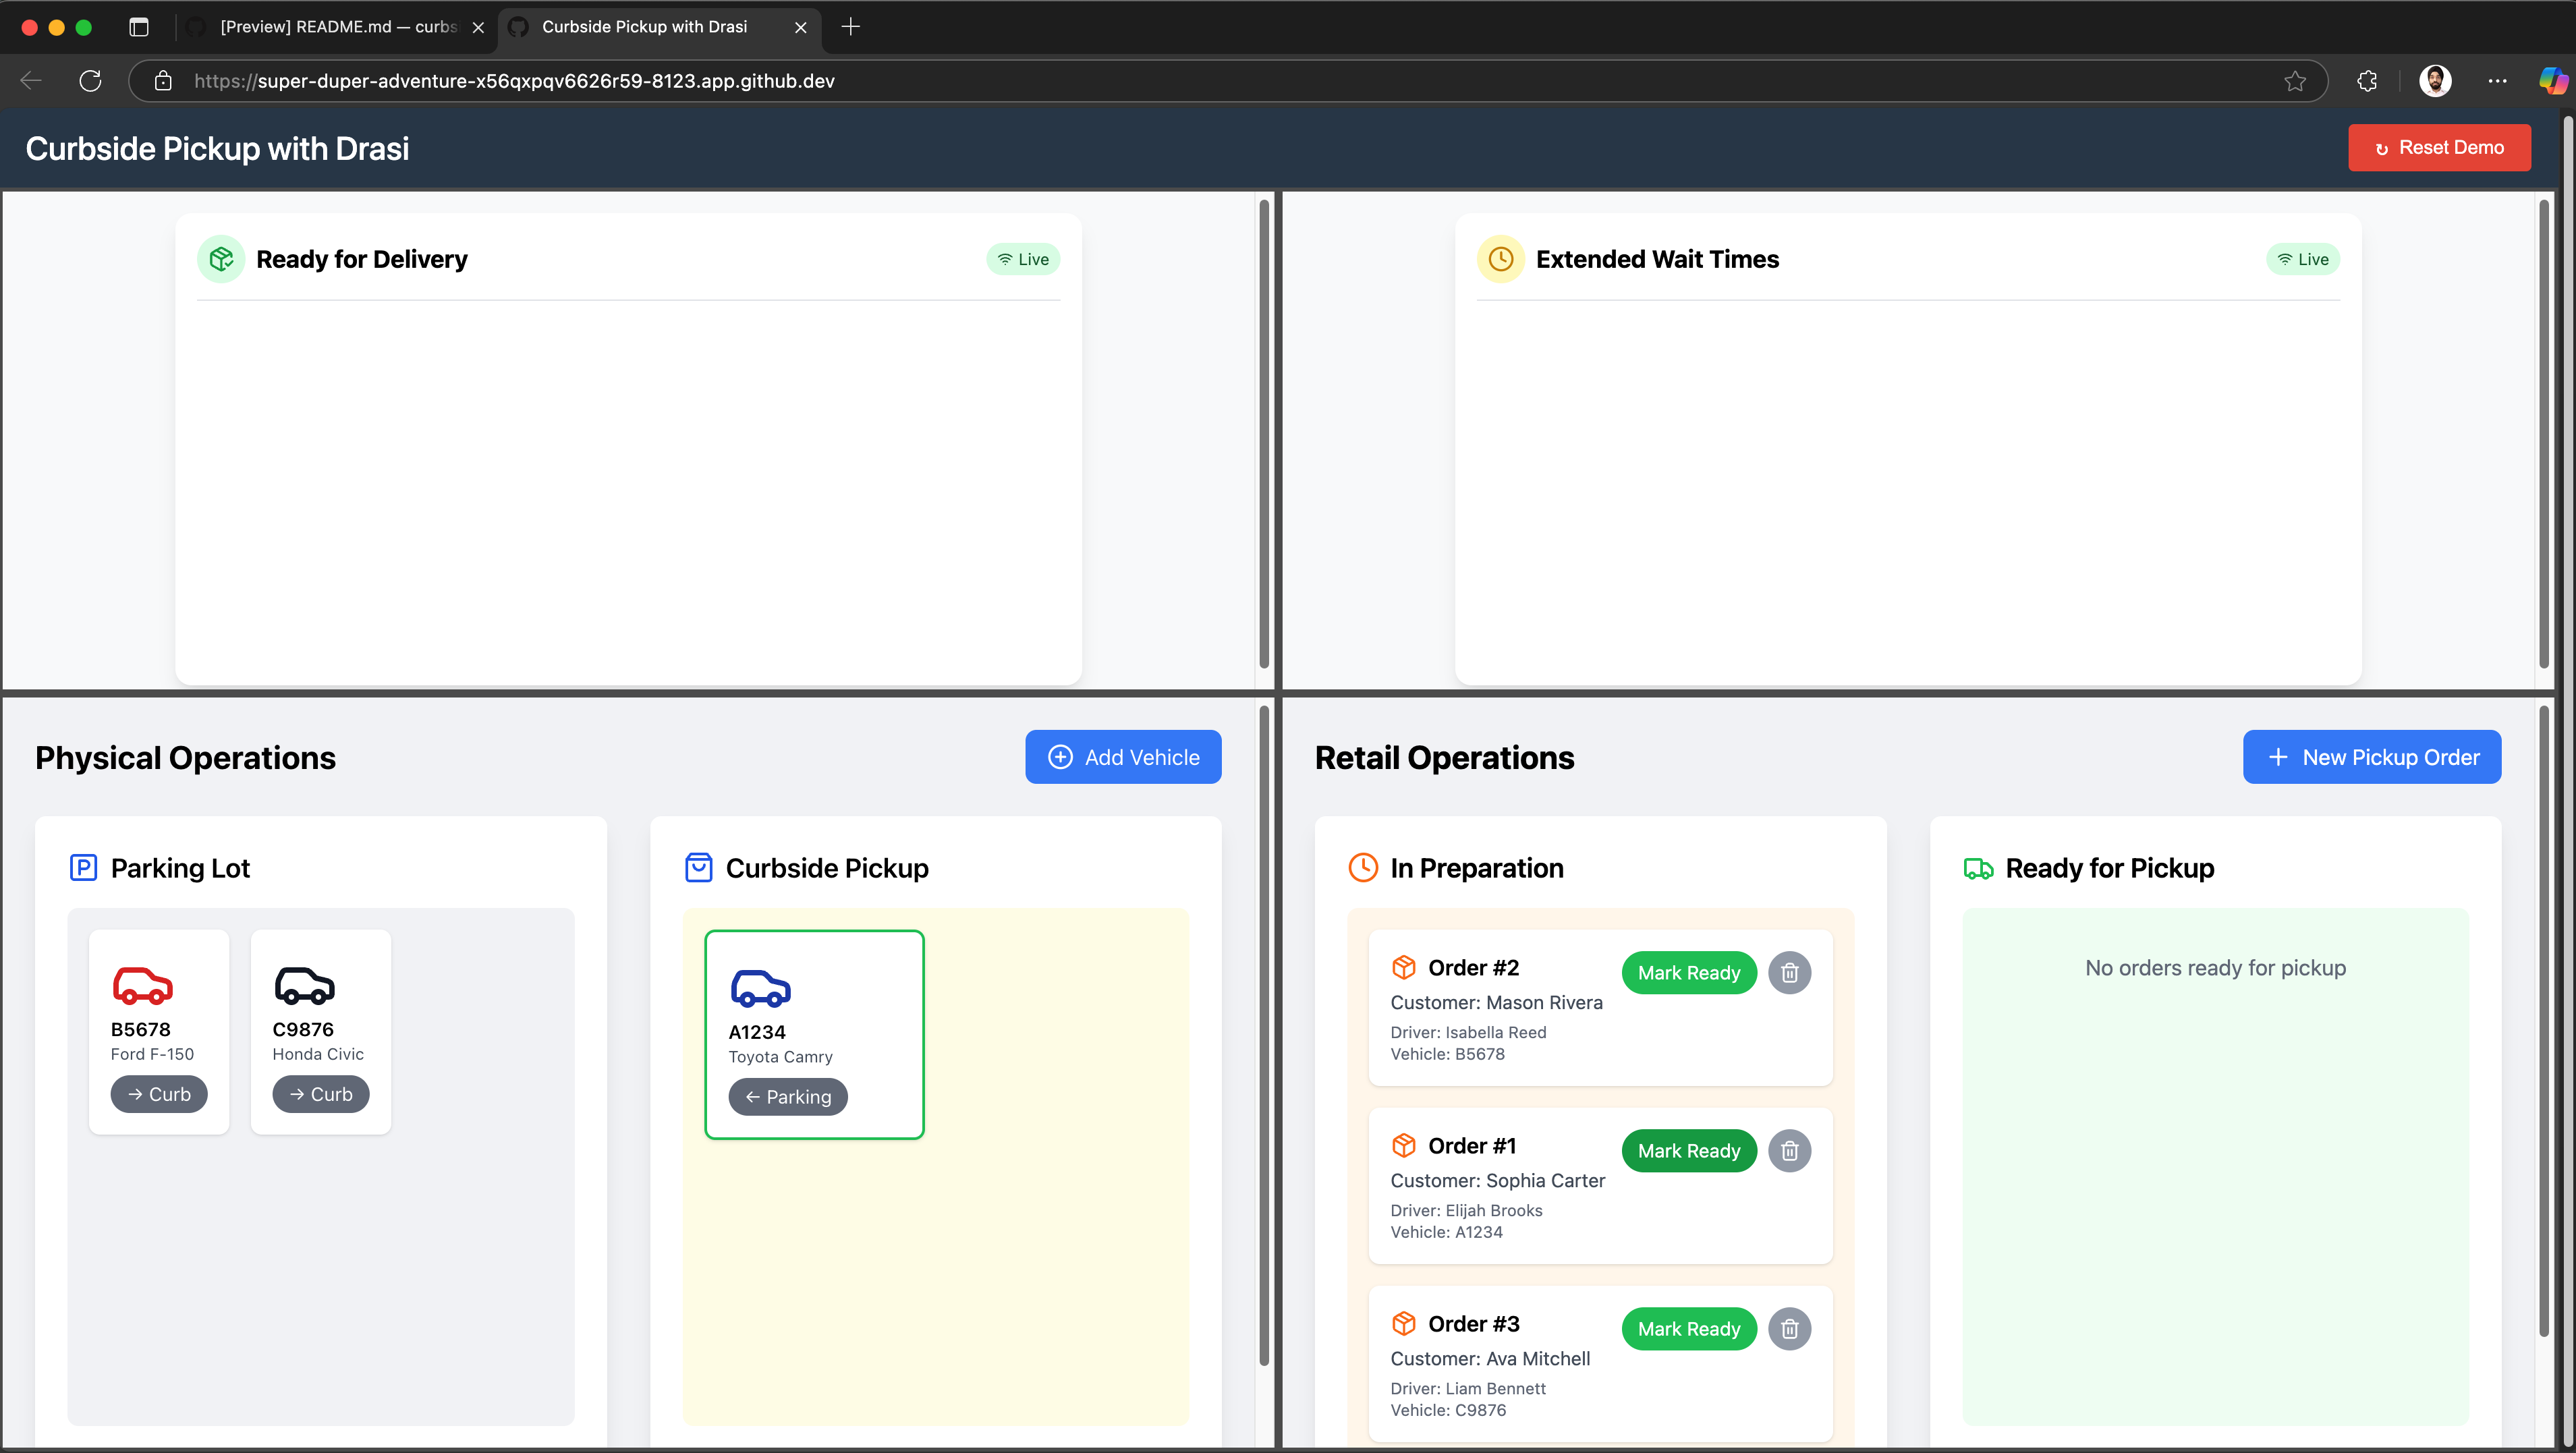
The demo should now be accessible at https://<your-codespace-id>-8123.app.github.dev/, and it should look like this:
If you refresh, you will notice that both dashboards will show their connection status as Live.
Drasi is running inside a k3d cluster inside your github codespaces container.
The Drasi tunnel for SignalR reaction has made the port accessible inside the codespace at port 8080.
The dashboard will however run your local browser. VS Code usually forwards port 8080 to the same port on localhost automatically.
Note: Please make sure that port 8080 is forwarded to 8080 on localhost:
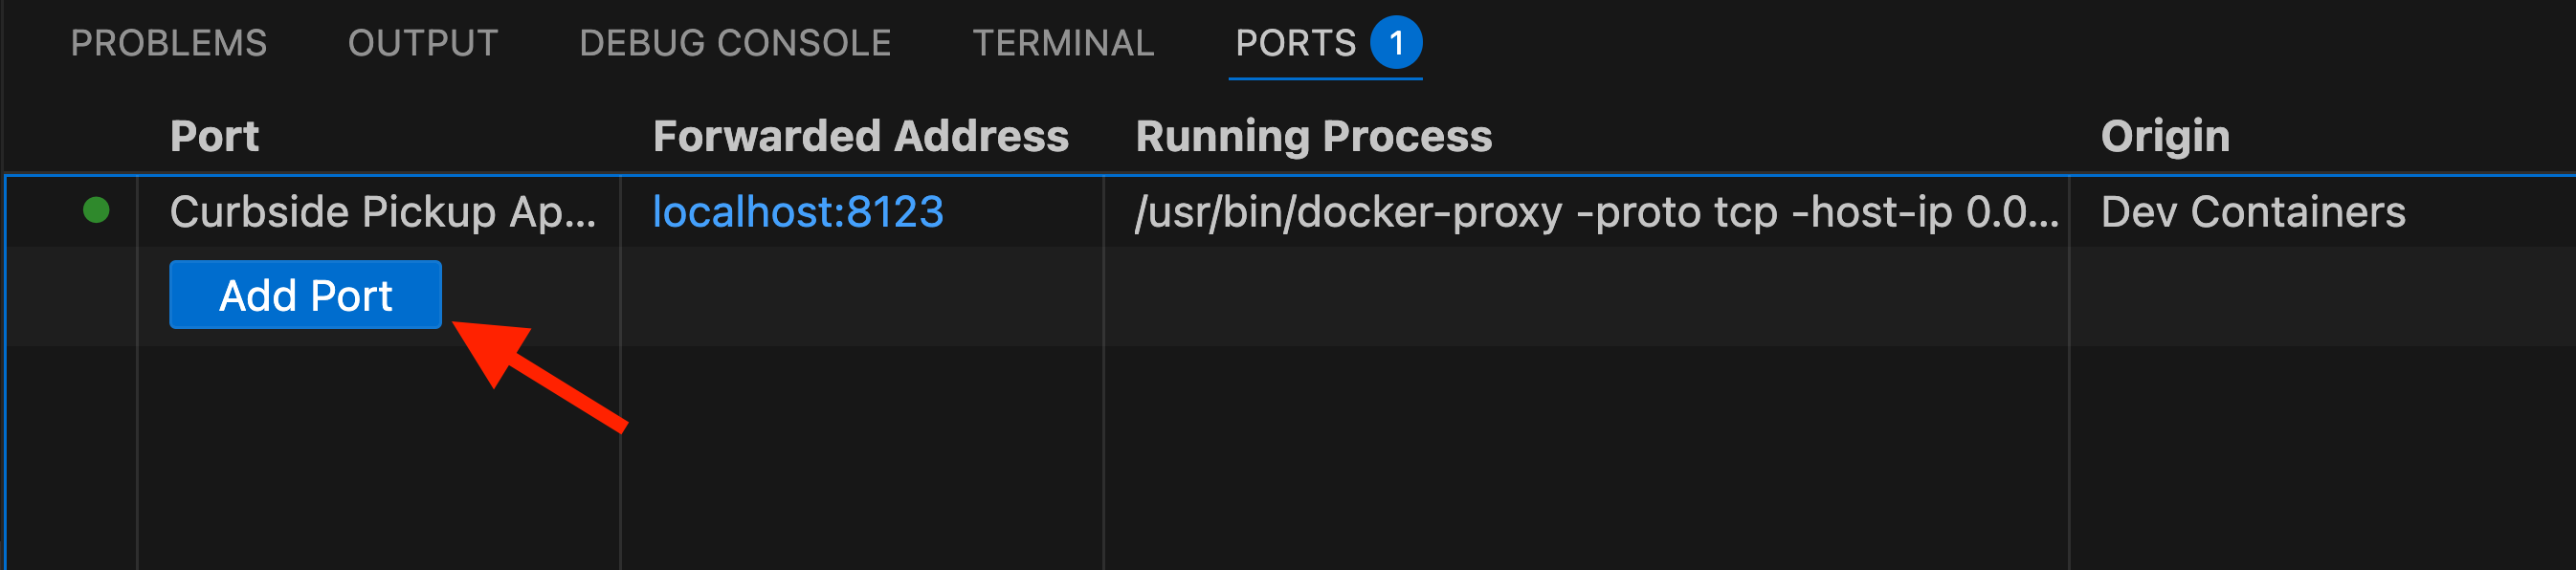
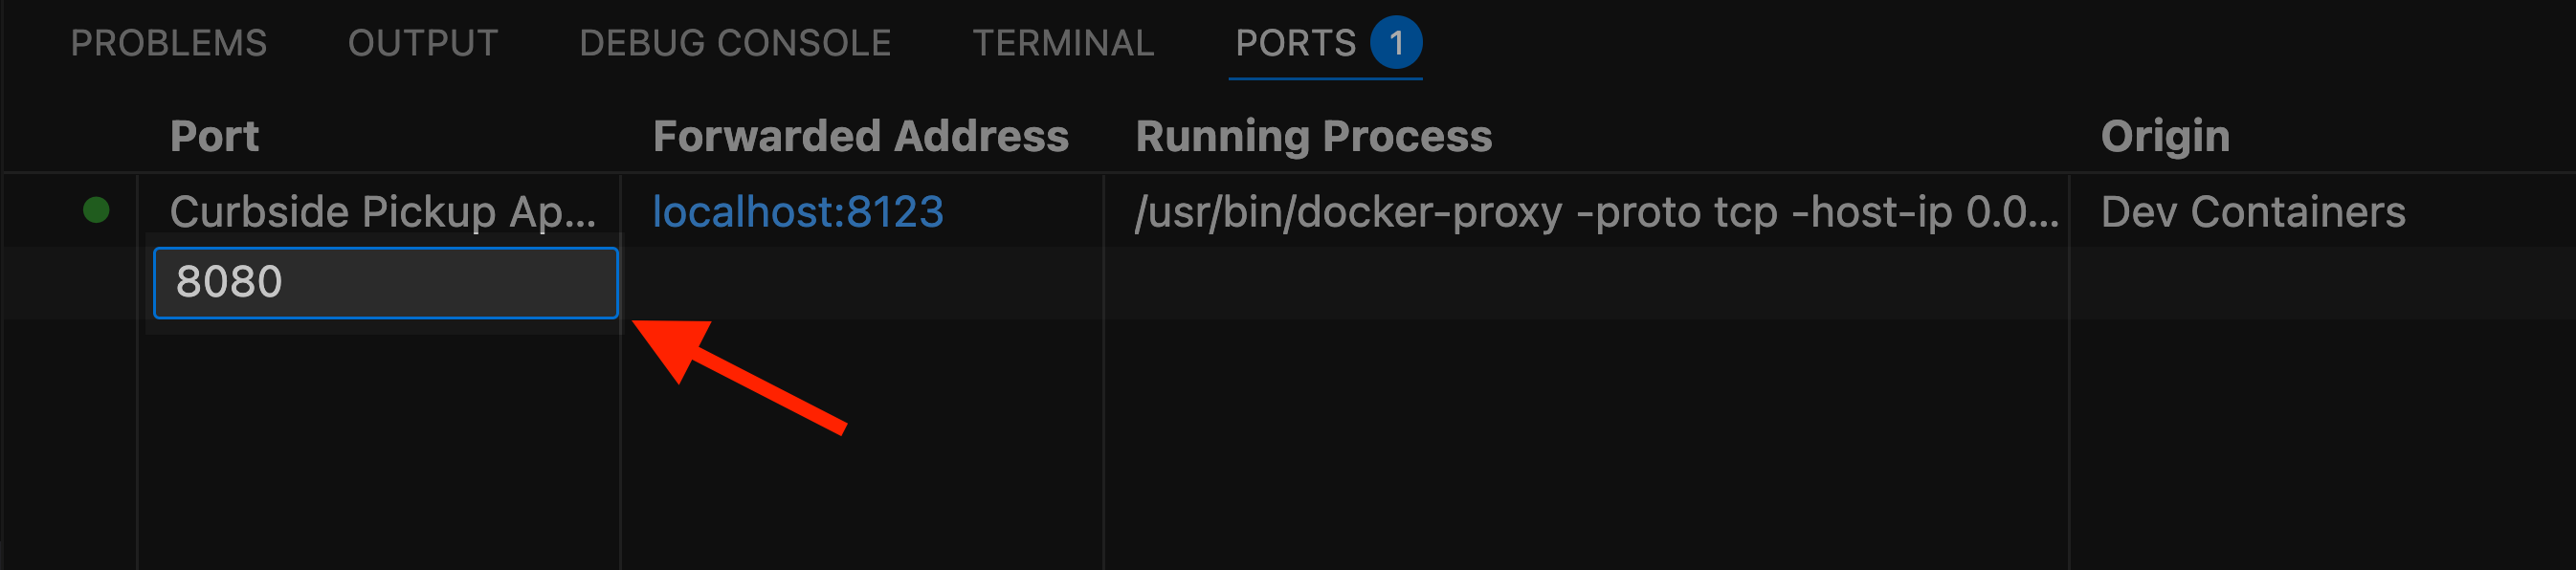
- Go to the PORTS tab in VS Code
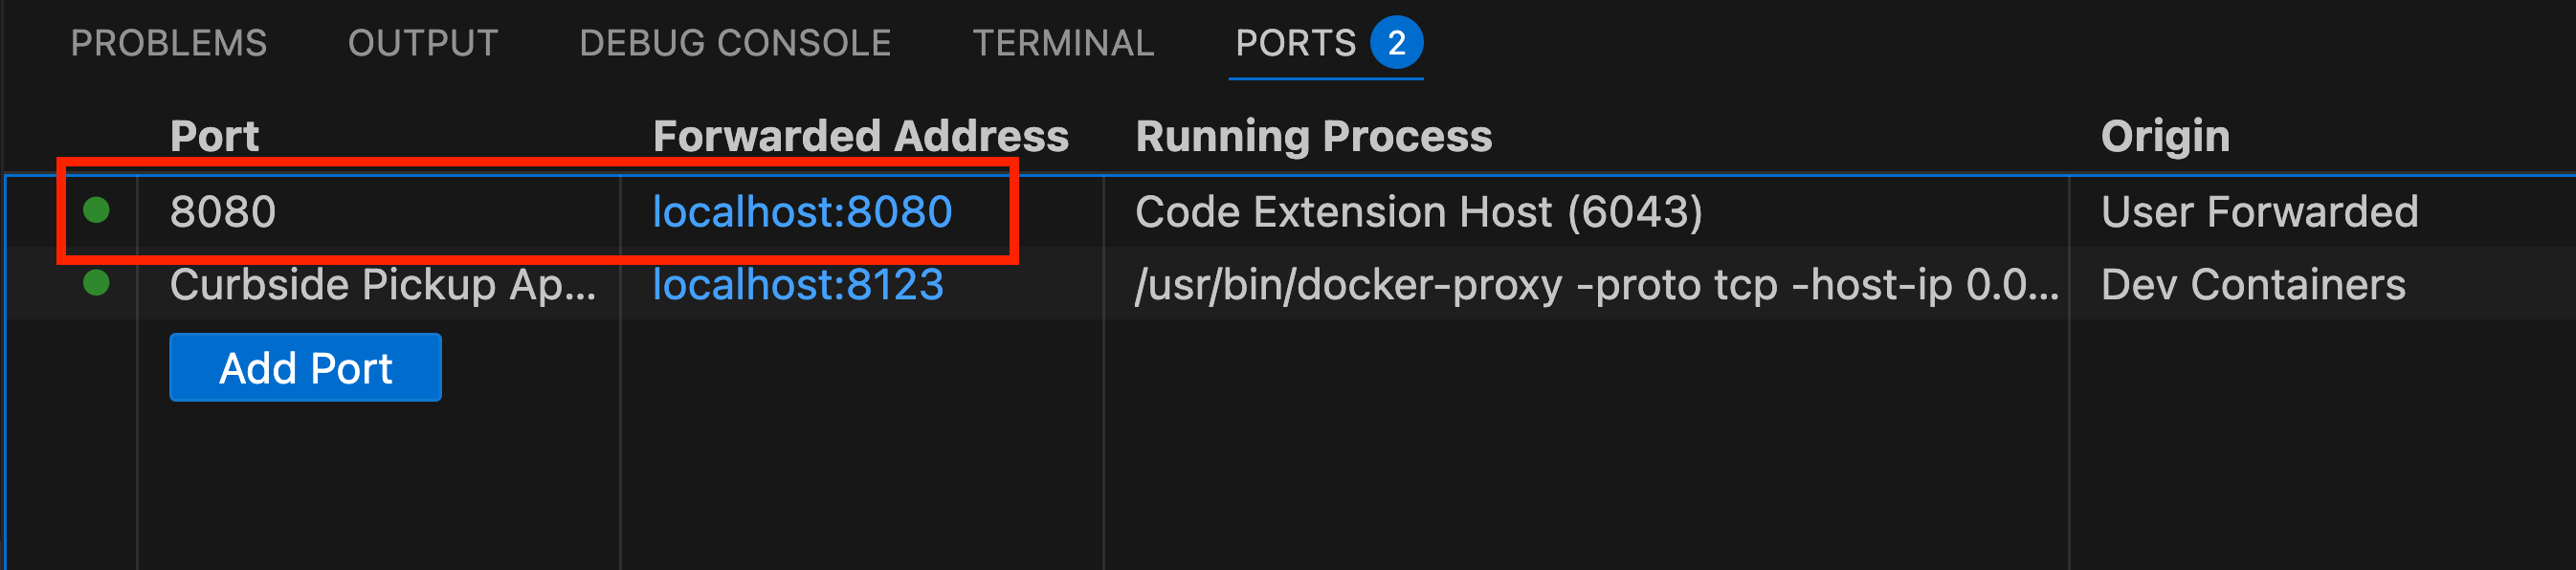
- Make sure an entry for port 8080 exists. If it does not, then please add one like this:
The demo should now be accessible at http://localhost:8123/, and it should look like this:

If you refresh, you will notice that both dashboards will show their connection status as Live.
No need to port forward. The Drasi Tunnel should already make your signalR reaction available in your machine at local port 8080.
The demo should now be accessible at http://localhost:8123/, and it should look like this:
If you refresh, you will notice that both dashboards will show their connection status as Live.
Testing the Reactiveness
Open the demo portal to see all four applications in a grid layout. Try these scenarios:
Test Matched Orders
-
In Physical Operations (bottom-left), move the Blue Toyota Camry (A1234) to “Curbside” by clicking the “-> Curb” button. This should move the car to the Curbside in the app UI as shown here:
-
In Retail Operations (bottom-right), click on “Mark Ready” button for “Order #1”. The order will move from “In Preparations” card to “Ready for Pickup” card in the app UI as shown here:
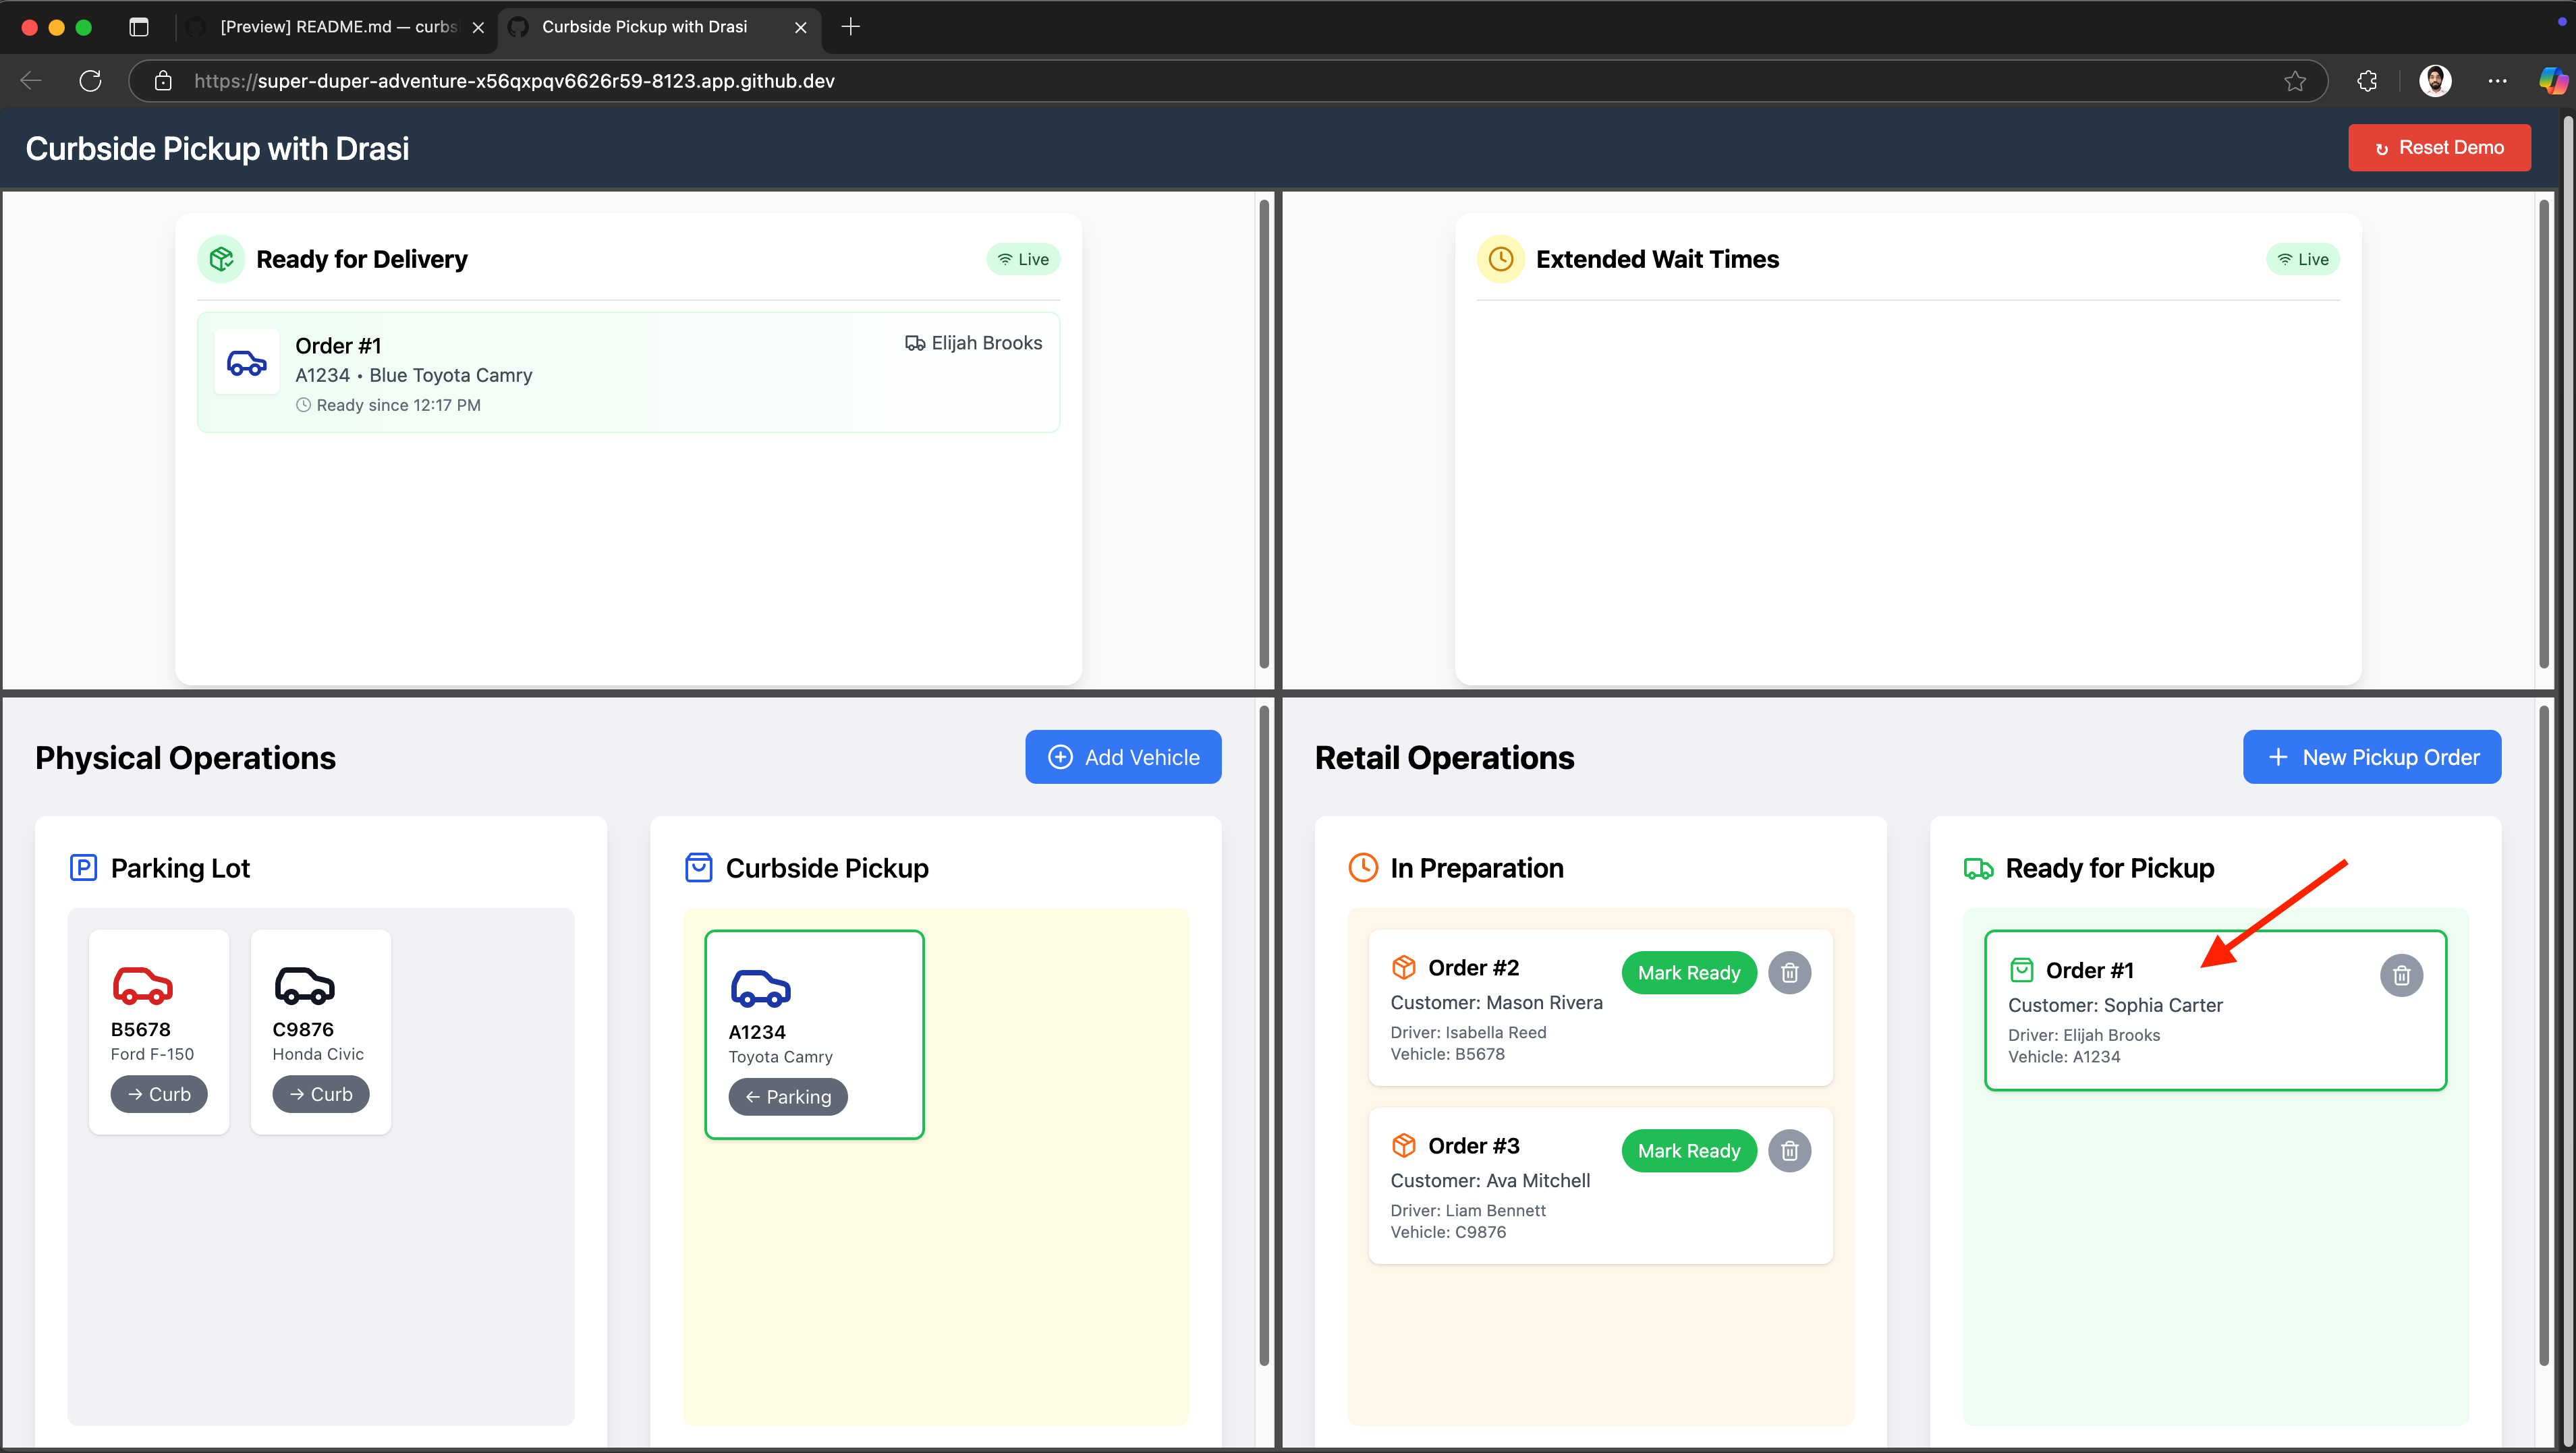
-
Watch the Delivery Dashboard (top-left) - the matched order appears within a couple seconds:
Test Extended Wait Alerts
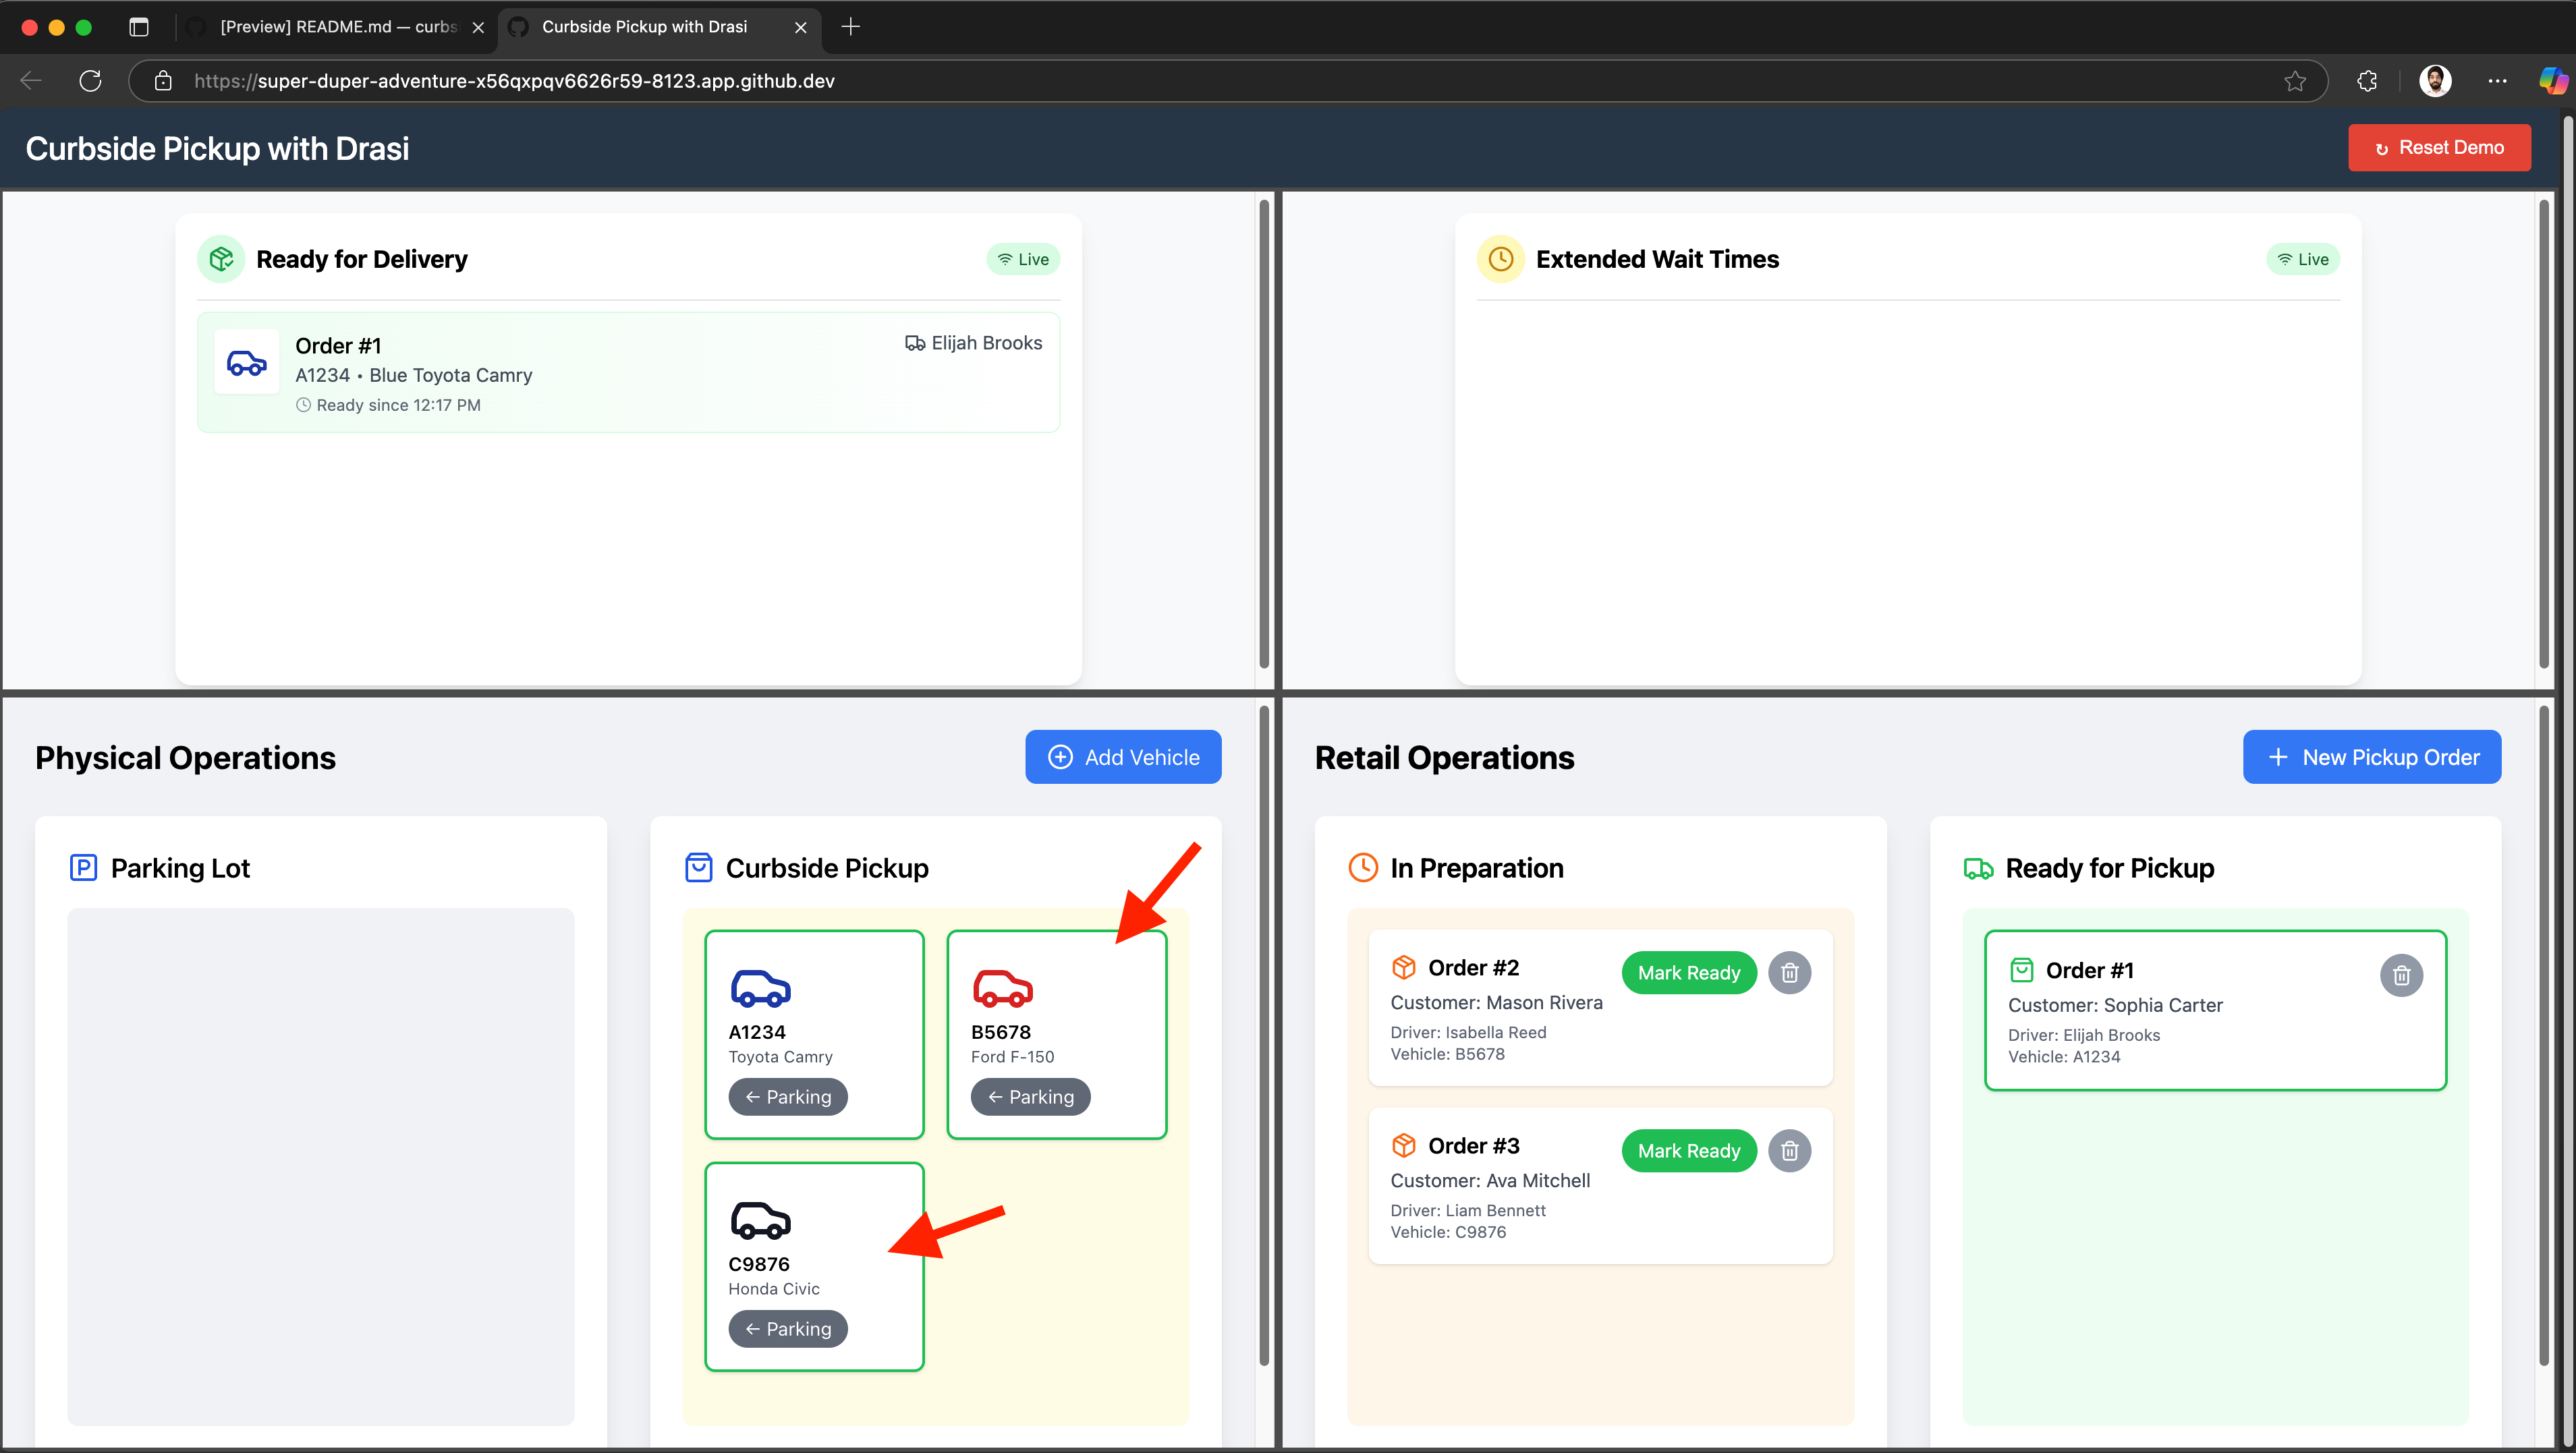
-
In Physical Operations, move other two cars “Red Ford F-150 (B5678)” and “Black Honda Civic (C9876) to “Curbside”:
-
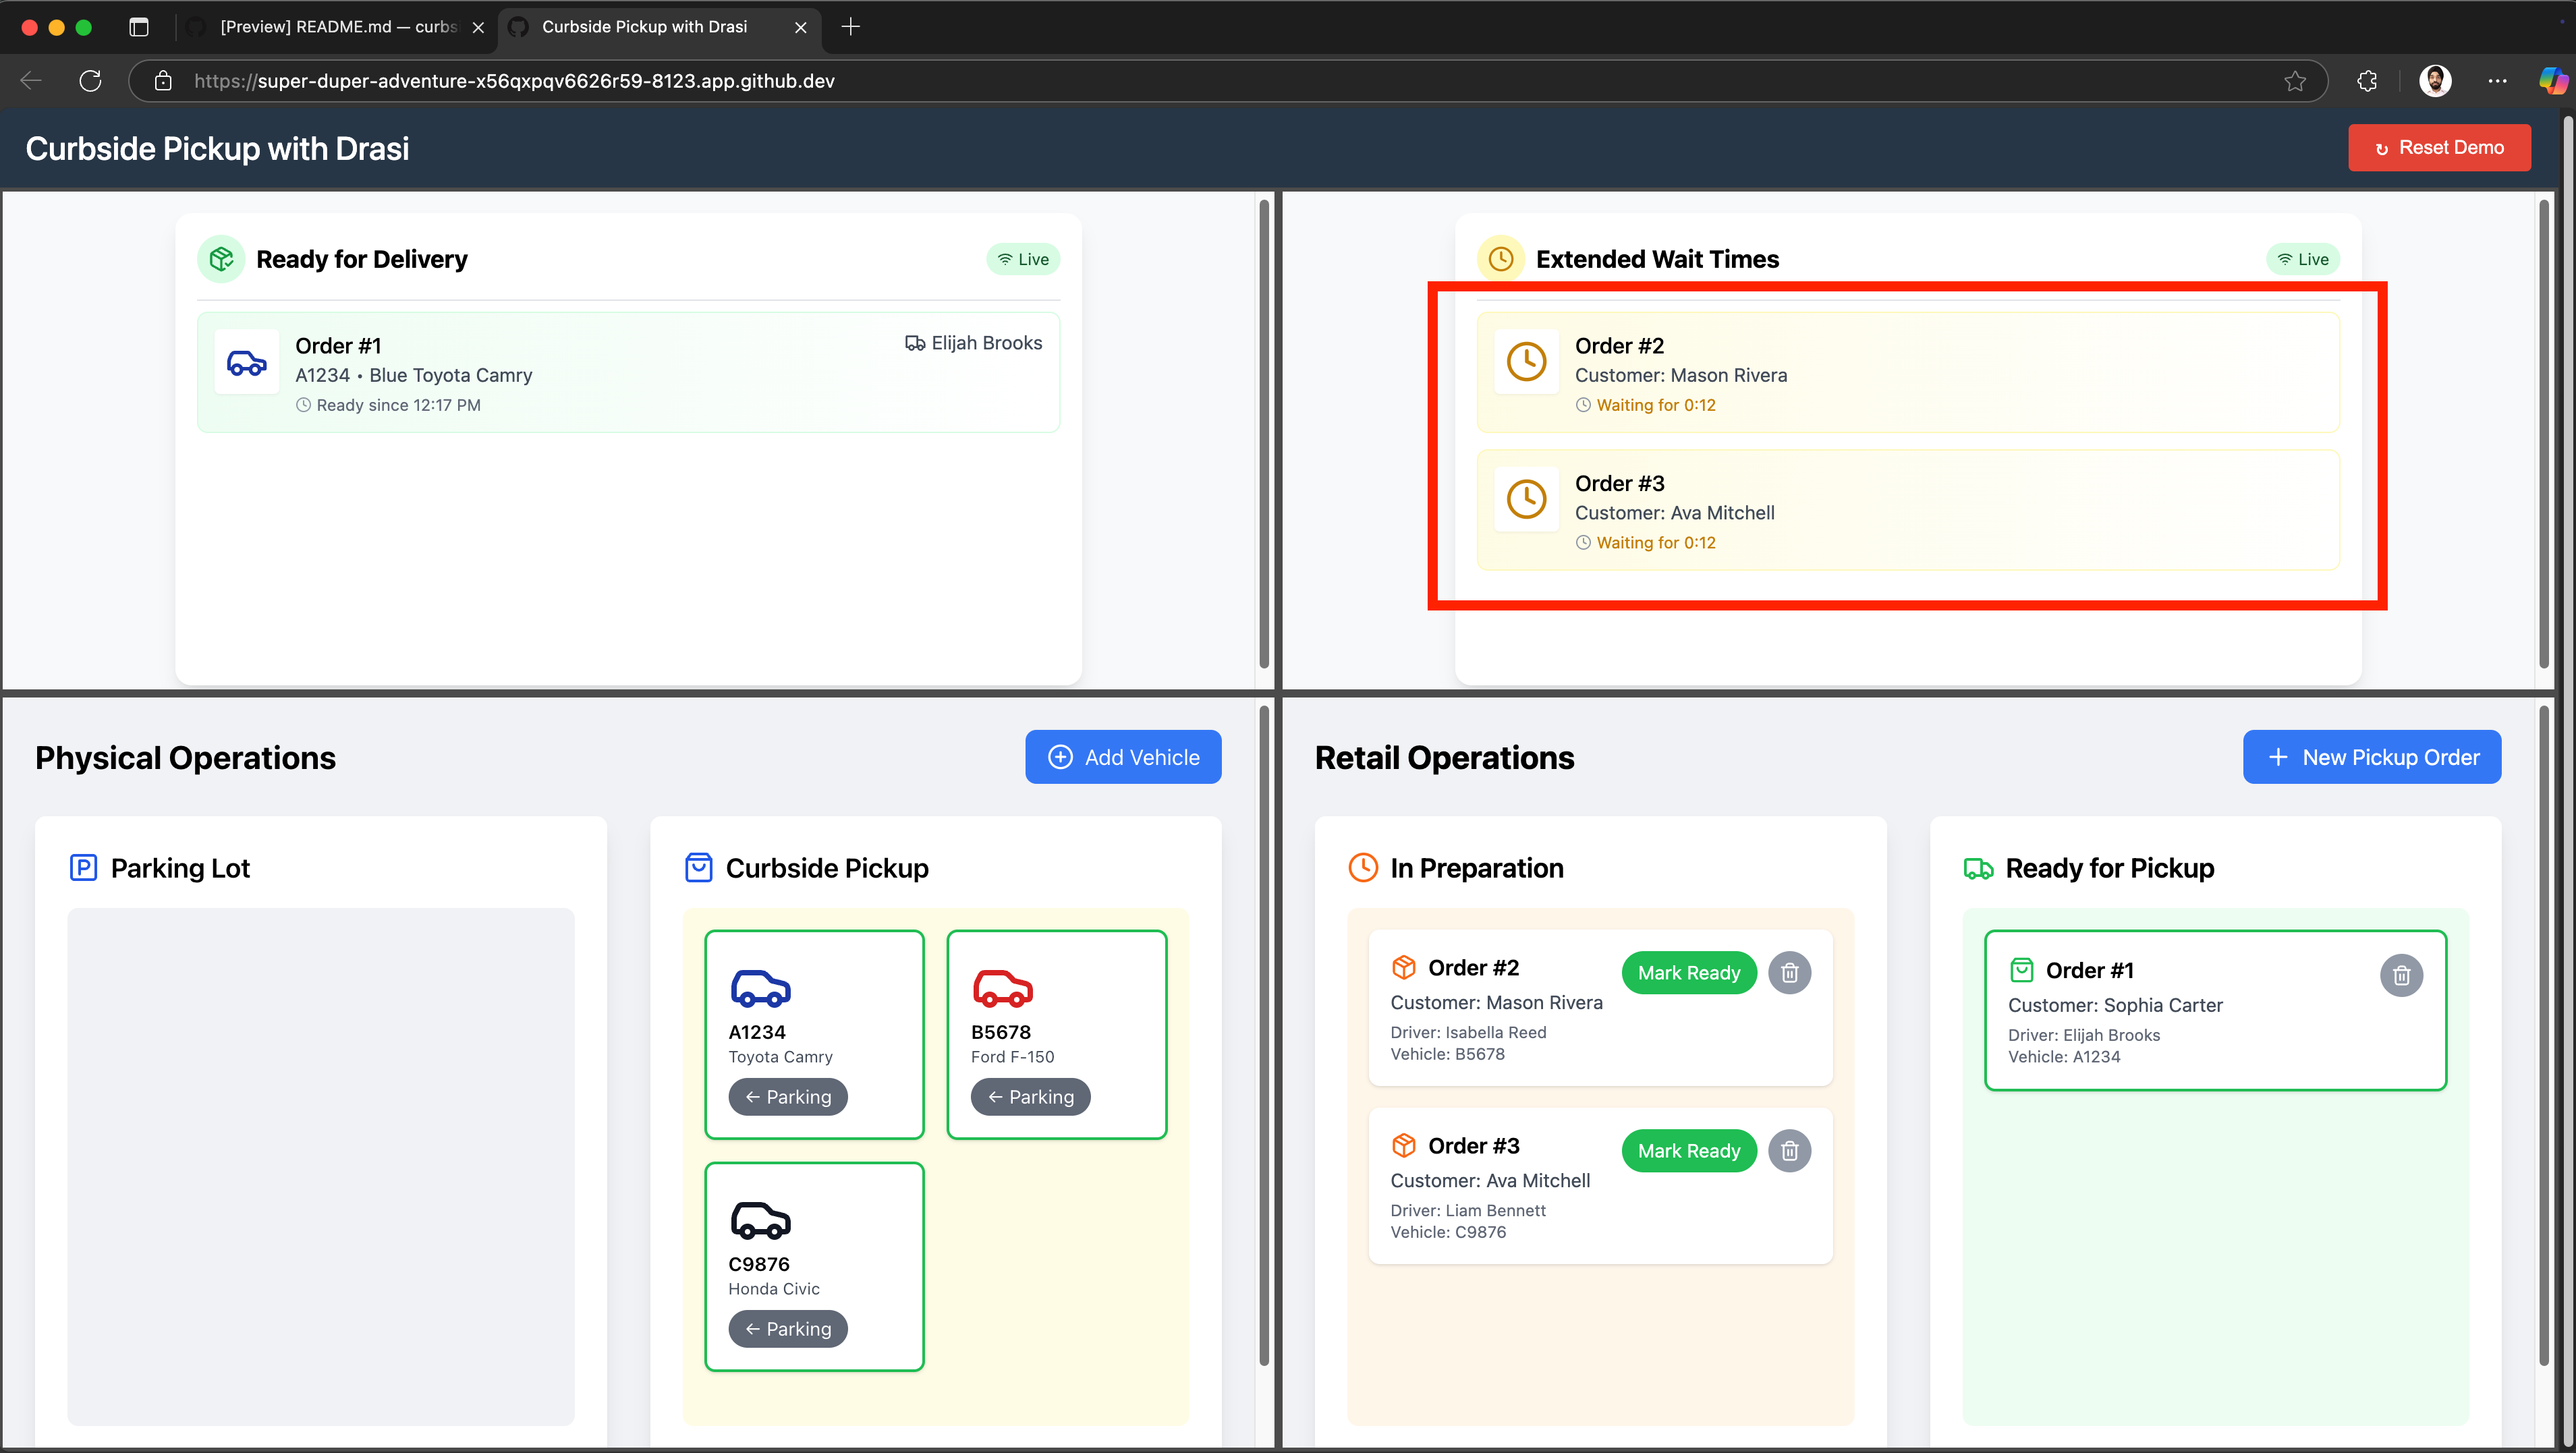
Wait about 10 seconds.
-
Watch the Delay Dashboard (top-right) - an alert will appear when these drivers have waited for more than 10 seconds for their order, as shown in the UI here:
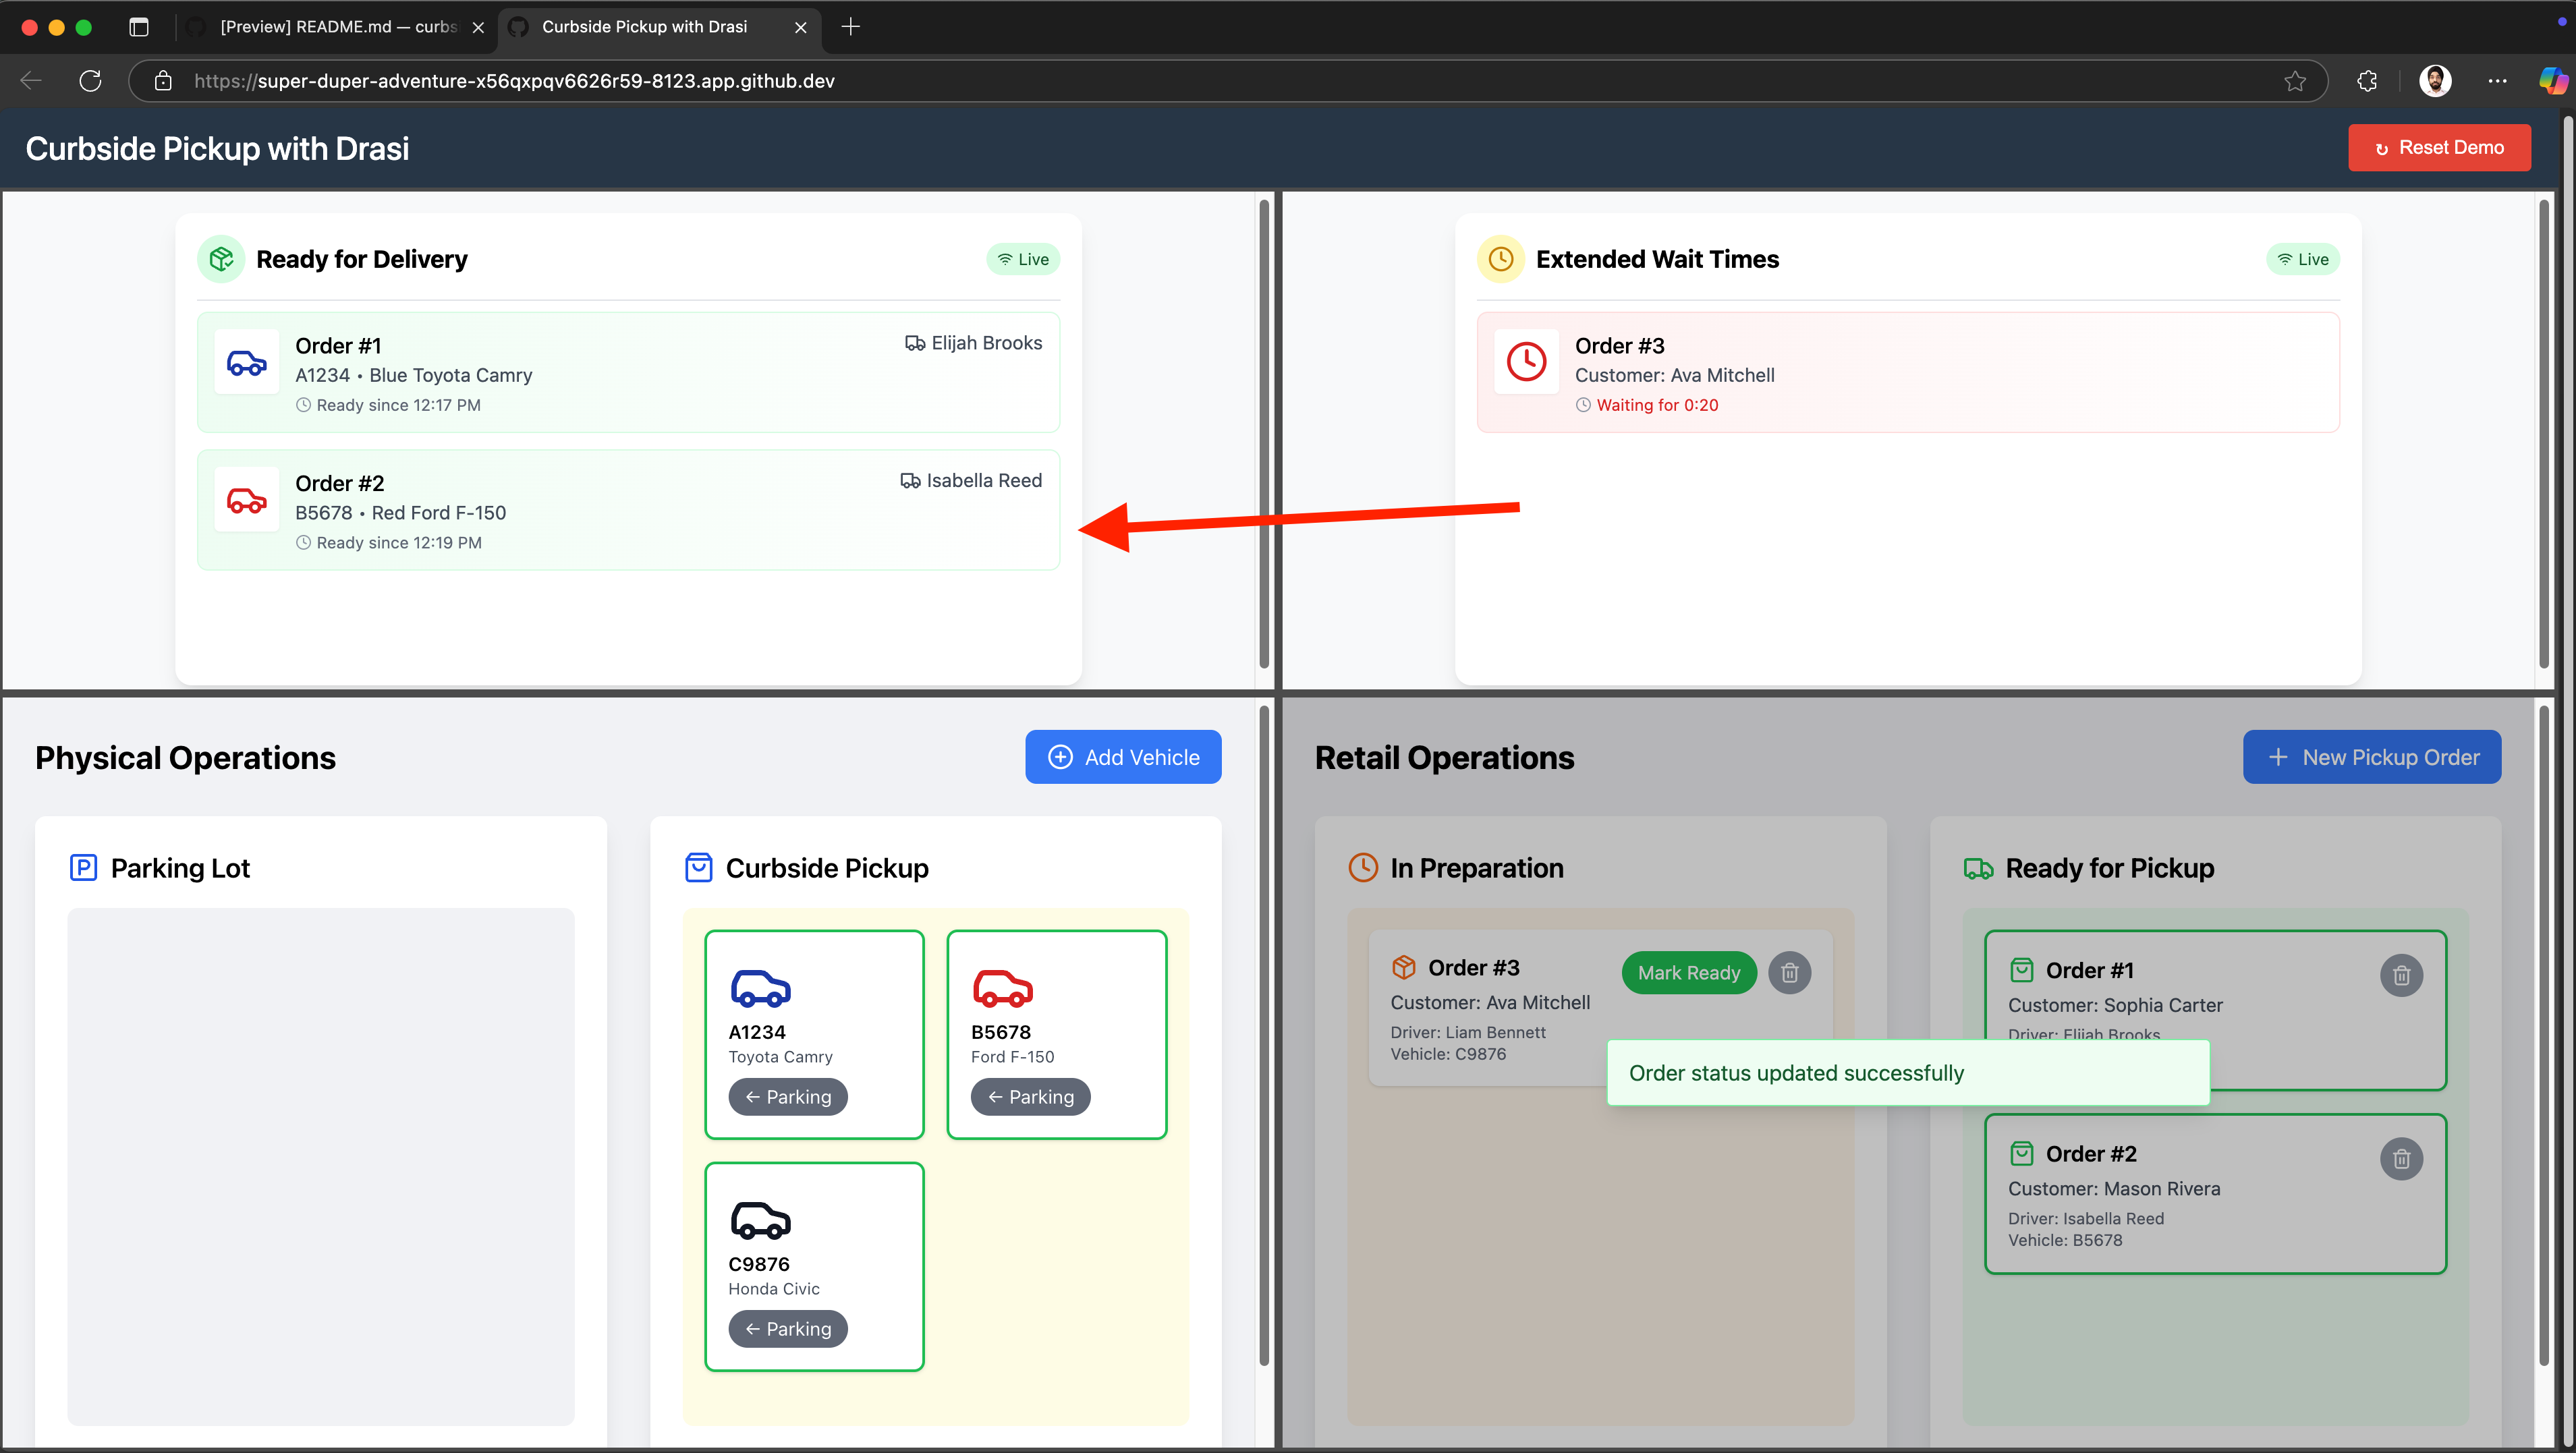
-
Click “Mark Ready” for “Order #2” as well in the Retail-Operations app. This should remove the order from Extended Wait Times (Delay) dashboard and move it to “Ready For Delivery” because the driver is at curbside and the order is now ready:
-
Finally after few seconds, also Click “Mark Ready” for “Order #3” as well in the Retail-Operations app. This should remove the final remaining order from Extended Wait Times (Delay) dashboard and move it to “Ready For Delivery” because the driver is at curbside and the order is now ready:
The dashboards update in real-time as you make changes, demonstrating Drasi’s ability to:
- Join data across PostgreSQL and MySQL databases
- Detect complex conditions including time-based rules
- Push updates instantly via SignalR
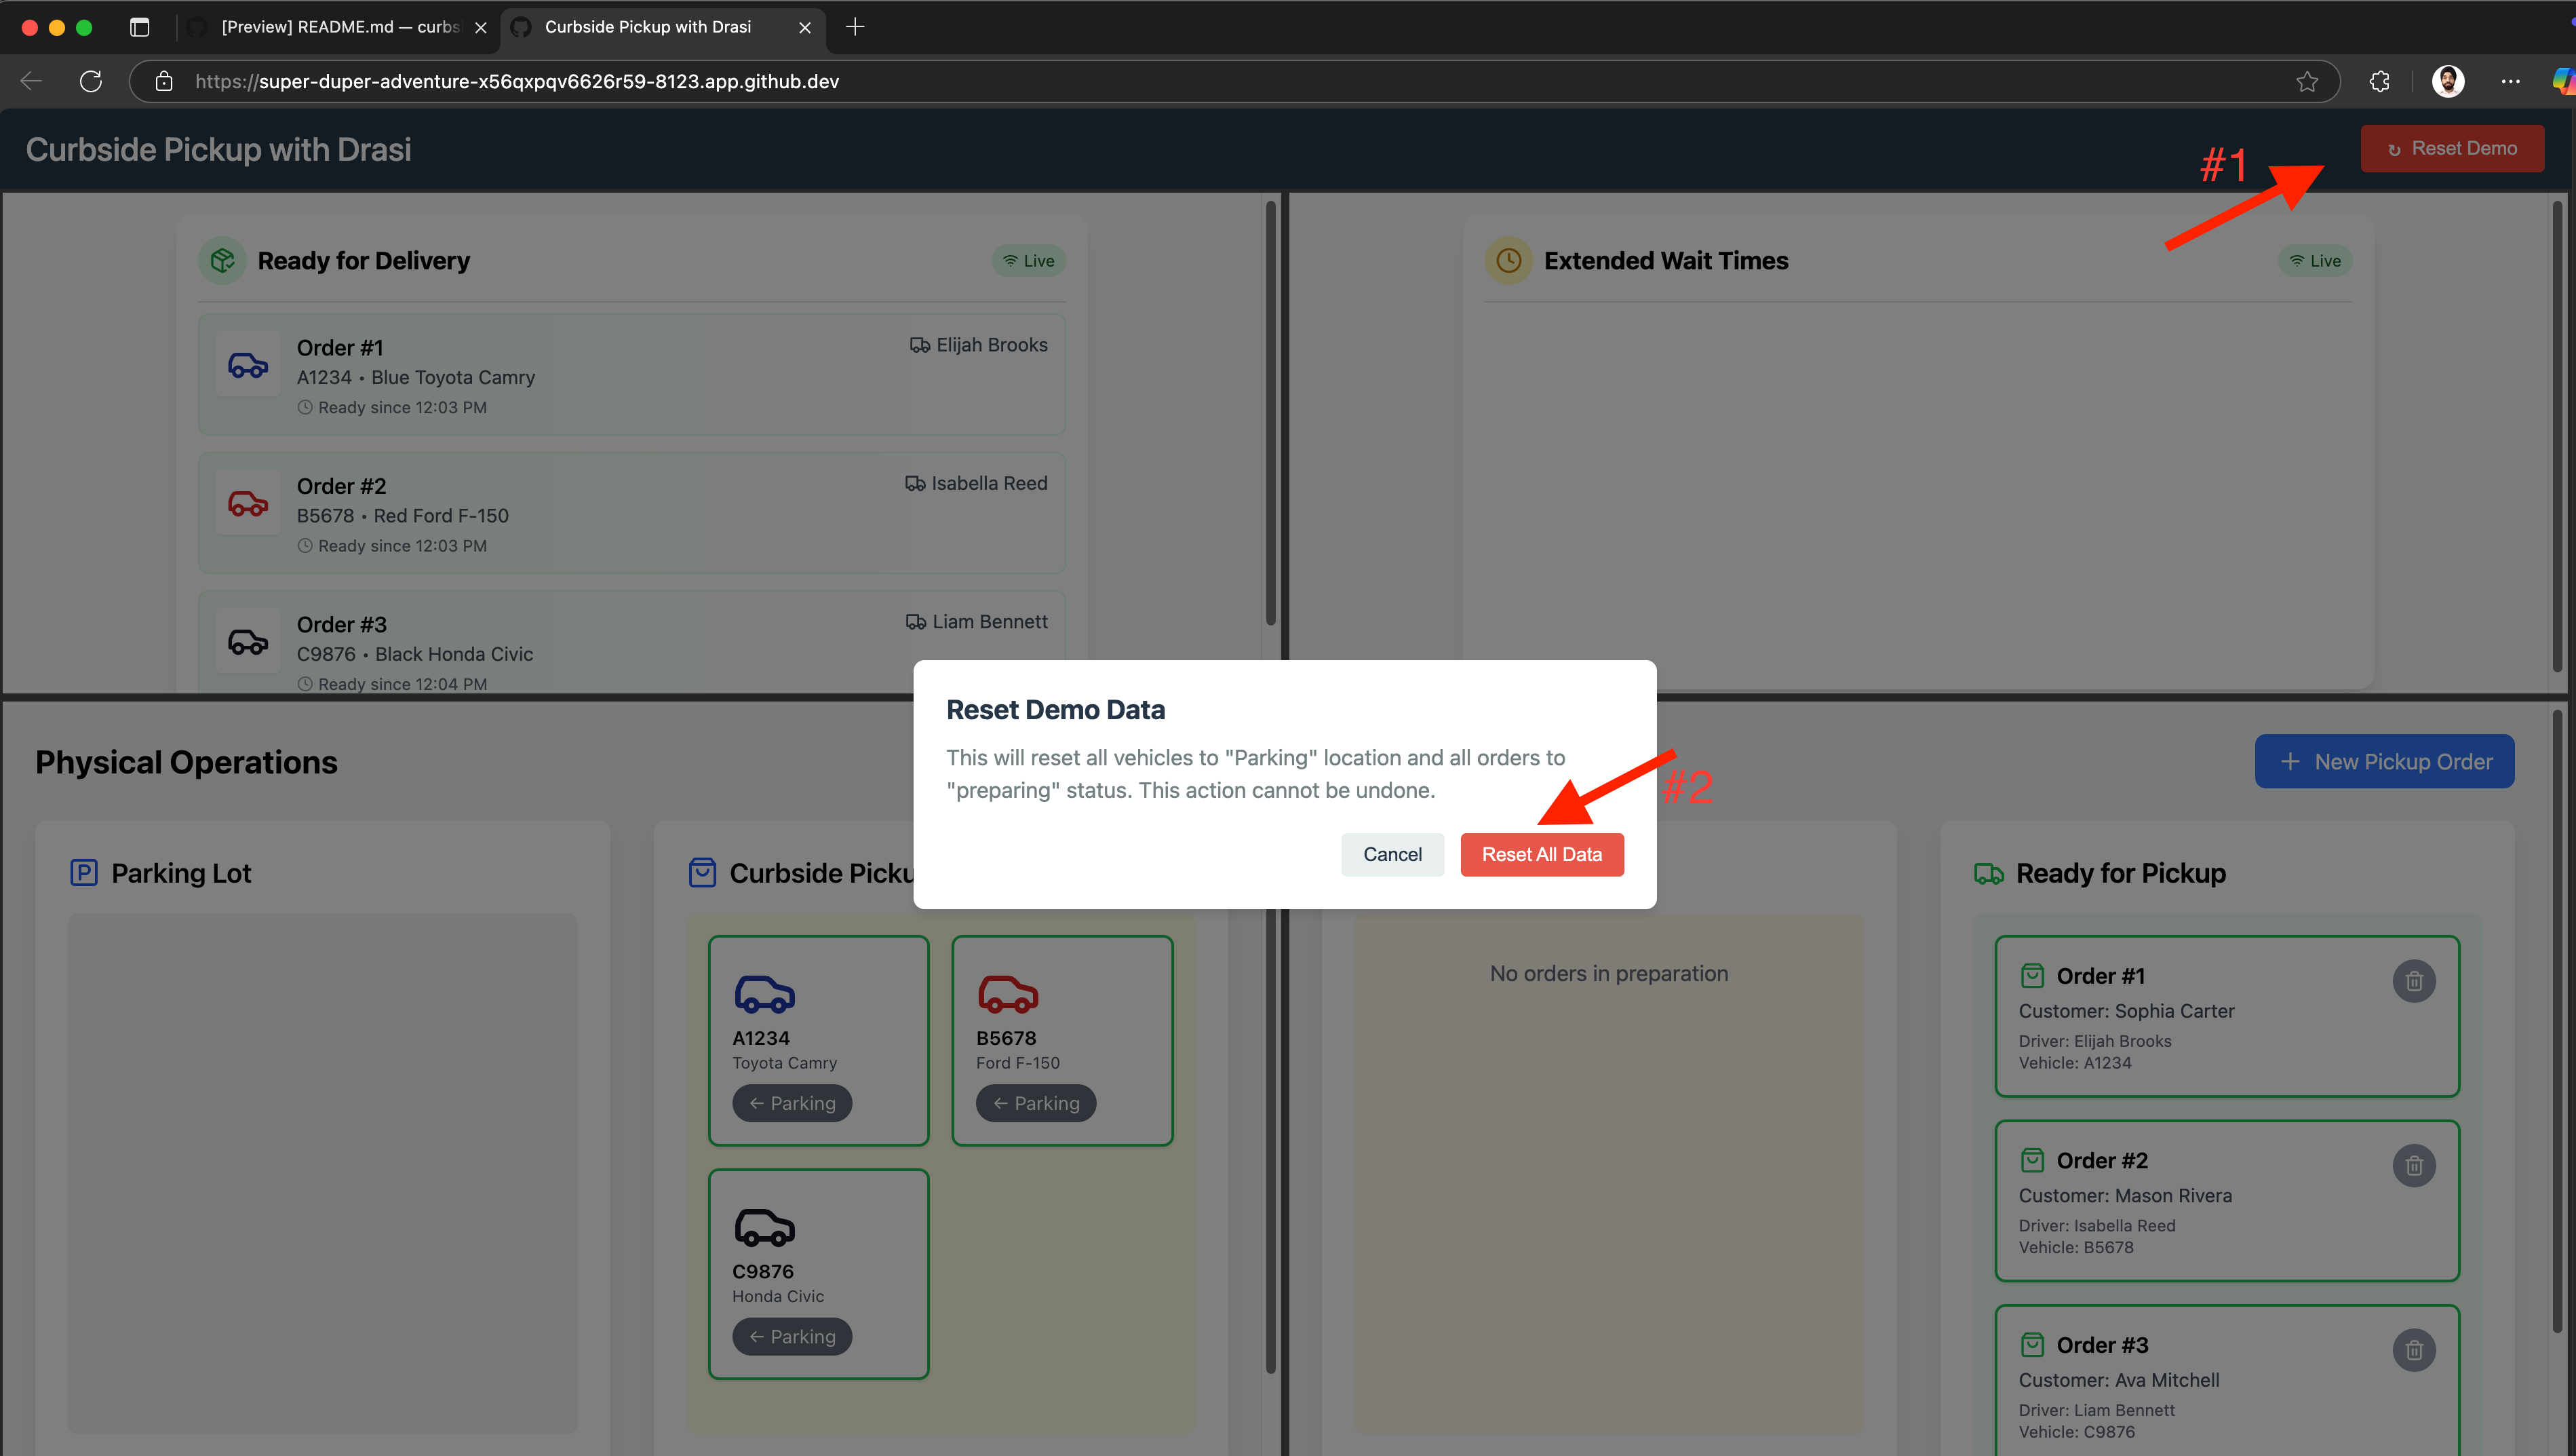
You can reset the demo by clicking the button on top right corner to play with these orders again, or you can create your own vehicles or orders to further test the reactivity of the dashboards built with help of Drasi.
Cleanup
Simply close the codespace window - No cleanup required. You may choose to delete your codespace to avoid additional billed usage.
Simply close your devcontainer and clean it up using the VS Code extension. Or, you can delete the docker container from Docker Desktop.
To clean up the tutorial, you can run the following scripts at the path tutorial/curbside-pickup:
macOS/Linux:
./scripts/cleanup-tutorial.sh
Windows (PowerShell):
.\scripts\cleanup-tutorial.ps1
This will give you options to:
- Delete tutorial resources (apps, database)
- Uninstall Drasi (optional)
- Delete the k3d cluster (optional)
Reflection
Congratulations! You were able to build two reactive dashboards UI for the curbside pickup scenario using Drasi. Let’s reflect on the journey we’ve been on.
Multiple data sources
We did not need to make any changes to the existing system we had setup with separate data systems for Order management & Vehicle Management. They both continue to live in separate databases of different kinds.
In the above walkthrough, we were able to add the existing Postgres and MySql instances as Sources in Drasi which opened them up to queries. All we needed was a YAML file that describes connection parameters for the DBs.
When writing the queries for our scenario, we did not have to worry about the fact that the data lives in two different stores. This is the power of Drasi - it allows us to write queries against a virtual graph of nodes and relationships that can span across data stored in disparate heterogeneous sources.
Synthetic Relationships in Continuous Queries helped Drasi in understanding how data across sources is connected so it can be modeled as a single virtual graph against which Cypher-style queries can be written.
No Code
Instead of writing complicated stream jobs as demonstrated in the Event Streaming section, or maintaining code for polling or event hooks, in Drasi we can write declarative Cypher-style queries that are fed into the system as a Configuration.
The difference between the effort involved in getting the Delay Dashboard is particularly glaring. Let’s take a look at what we did for Delay Dashboard with Flink.
-- 1. Define the Orders Source Table (PostgreSQL CDC via Kafka)
CREATE TABLE orders (
  order_id STRING,
  pickup_vehicle_plate STRING,
  order_status STRING,
  event_time TIMESTAMP(3),
  WATERMARK FOR event_time AS event_time - INTERVAL '5' SECOND,
  PRIMARY KEY (pickup_vehicle_plate) NOT ENFORCED
) WITH (
  'connector' = 'kafka',
  'topic' = 'order_changes',
  'properties.bootstrap.servers' = 'localhost:9092',
  'format' = 'debezium-json',
  'scan.startup.mode' = 'earliest-offset'
);

-- 2. Define the Vehicles Source Table (MySQL CDC via Kafka)
CREATE TABLE vehicles (
  pickup_vehicle_plate STRING,
  vehicle_location STRING,
  event_time TIMESTAMP(3),
  WATERMARK FOR event_time AS event_time - INTERVAL '5' SECOND,
  PRIMARY KEY (pickup_vehicle_plate) NOT ENFORCED
) WITH (
  'connector' = 'kafka',
  'topic' = 'vehicle_changes',
  'properties.bootstrap.servers' = 'localhost:9092',
  'format' = 'debezium-json',
  'scan.startup.mode' = 'earliest-offset'
);

-- 3. Enrich Vehicle Events with Latest Order Status
CREATE VIEW enriched_vehicle_events AS
SELECT
  v.pickup_vehicle_plate,
  v.vehicle_location,
  o.order_status,
  v.event_time
FROM vehicles v
LEFT JOIN orders FOR SYSTEM_TIME AS OF v.event_time AS o
ON v.pickup_vehicle_plate = o.pickup_vehicle_plate;

-- 4. Enrich Order Events with Latest Vehicle Location
CREATE VIEW enriched_order_events AS
SELECT
  o.pickup_vehicle_plate,
  v.vehicle_location,
  o.order_status,
  o.event_time
FROM orders o
LEFT JOIN vehicles FOR SYSTEM_TIME AS OF o.event_time AS v
ON o.pickup_vehicle_plate = v.pickup_vehicle_plate;

-- 5. Combine All Enriched Events into a Single Stream
CREATE VIEW all_enriched_events AS
SELECT
  'vehicle' AS event_type,
  pickup_vehicle_plate,
  vehicle_location,
  order_status,
  event_time
FROM enriched_vehicle_events
UNION ALL
SELECT
  'order' AS event_type,
  pickup_vehicle_plate,
  vehicle_location,
  order_status,
  event_time
FROM enriched_order_events;

-- 6. Track Waiting State and Transitions
CREATE VIEW events_with_state AS
SELECT
  *,
  vehicle_location = 'Curbside' AND order_status != 'Ready' AS is_waiting,
  LAG(vehicle_location = 'Curbside' AND order_status != 'Ready', 1, FALSE)
    OVER (PARTITION BY pickup_vehicle_plate ORDER BY event_time) AS prev_is_waiting
FROM all_enriched_events;

-- 7. Identify Start Events (Waiting Begins)
CREATE VIEW start_events AS
SELECT
  pickup_vehicle_plate,
  event_time AS start_time
FROM events_with_state
WHERE is_waiting AND NOT prev_is_waiting;

-- 8. Identify End Events (Waiting Ends)
CREATE VIEW end_events AS
SELECT
  pickup_vehicle_plate,
  event_time AS end_time
FROM events_with_state
WHERE NOT is_waiting AND prev_is_waiting;

-- 9. Define the Output Sink Table
CREATE TABLE delayed_orders (
  op STRING,
  pickup_vehicle_plate STRING,
  time TIMESTAMP(3)
) WITH (
  'connector' = 'kafka',
  'topic' = 'delayed_orders',
  'properties.bootstrap.servers' = 'localhost:9092',
  'format' = 'json'
);

-- 10. Generate Insert and Delete Events
INSERT INTO delayed_orders
SELECT
  'insert' AS op,
  s.pickup_vehicle_plate,
  s.start_time AS time
FROM start_events s
LEFT OUTER JOIN end_events e
ON s.pickup_vehicle_plate = e.pickup_vehicle_plate
AND e.end_time > s.start_time
AND e.end_time <= s.start_time + INTERVAL '5' MINUTE
WHERE e.end_time IS NULL
UNION ALL
SELECT
  'delete' AS op,
  pickup_vehicle_plate,
  end_time AS time
FROM end_events;
If we contrast this with the simple YAML file used for the Drasi query, with the much simpler Cypher query using future functions, the power and appeal of Drasi becomes unmistakably evident. The Cypher query is not just more concise but arguably easier to write, understand and maintain over time.
kind: ContinuousQuery
apiVersion: v1
name: delay
spec:
  mode: query
  sources:
    subscriptions:
      - id: physical-ops
        nodes:
          - sourceLabel: vehicles
      - id: retail-ops
        nodes:
          - sourceLabel: orders
    joins:
      - id: PICKUP_BY
        keys:
          - label: vehicles
            property: plate
          - label: orders
            property: plate
  query: >
    MATCH (o:orders)-[:PICKUP_BY]->(v:vehicles)
    WHERE o.status != 'ready'
    WITH
      o, v,
      drasi.changeDateTime(v) AS waitingSinceTimestamp
    WHERE
      waitingSinceTimestamp != datetime({epochMillis: 0}) AND
      drasi.trueFor(v.location = 'Curbside', duration ({ seconds: 10 }))
    RETURN
      o.id AS orderId,
      o.customer_name as customerName,
      waitingSinceTimestamp
The declarative approach taken by Drasi not only removes the need of writing and maintaining code, its choice of Cypher syntax gives it incredible expressive power which makes queries far less complicated than can ever be in SQL.
Reactiveness
The dashboards built with Drasi are reactive to changes almost instantaneously. This can be observed by fiddling the vehicles & orders data as described in the Demo time section.
This is in contrast to any approaches involving polling as they would inherently have at least have as much delay as the polling interval.
The stream processing approach can be as reactive as Drasi, however it depends on the Debezium setup for CDC being accurately tuned and the backend service consuming the output topics without delay and pushing the updates to the clients in a snappy manner.
With Drasi, all that is taken care of by the platform and the developers need to provide simple YAML configs for their data sources, queries and reactions to get result sets that are continuously accurate (in near real time).
Summary
With this example, we hope that we have demonstrated that just by writing a few YAML-config files and Cypher-style declarative queries, we can build new systems that are truly reactive using data from existing systems even if data lives in disparate and heterogeneous systems.
Learn more about "Why Drasi?" here.
What’s next?
Here are some additional resources:
- Learn more about Drasi sources here.
- Learn more about Continuous queries here.
- Learn more about Drasi Reactions here.
Appendix: Database Client
If you want to look at the PostgreSQL database, you may use psql for your local setup. For codespaces and devcontainers, we have included a helpful DB Client extension:
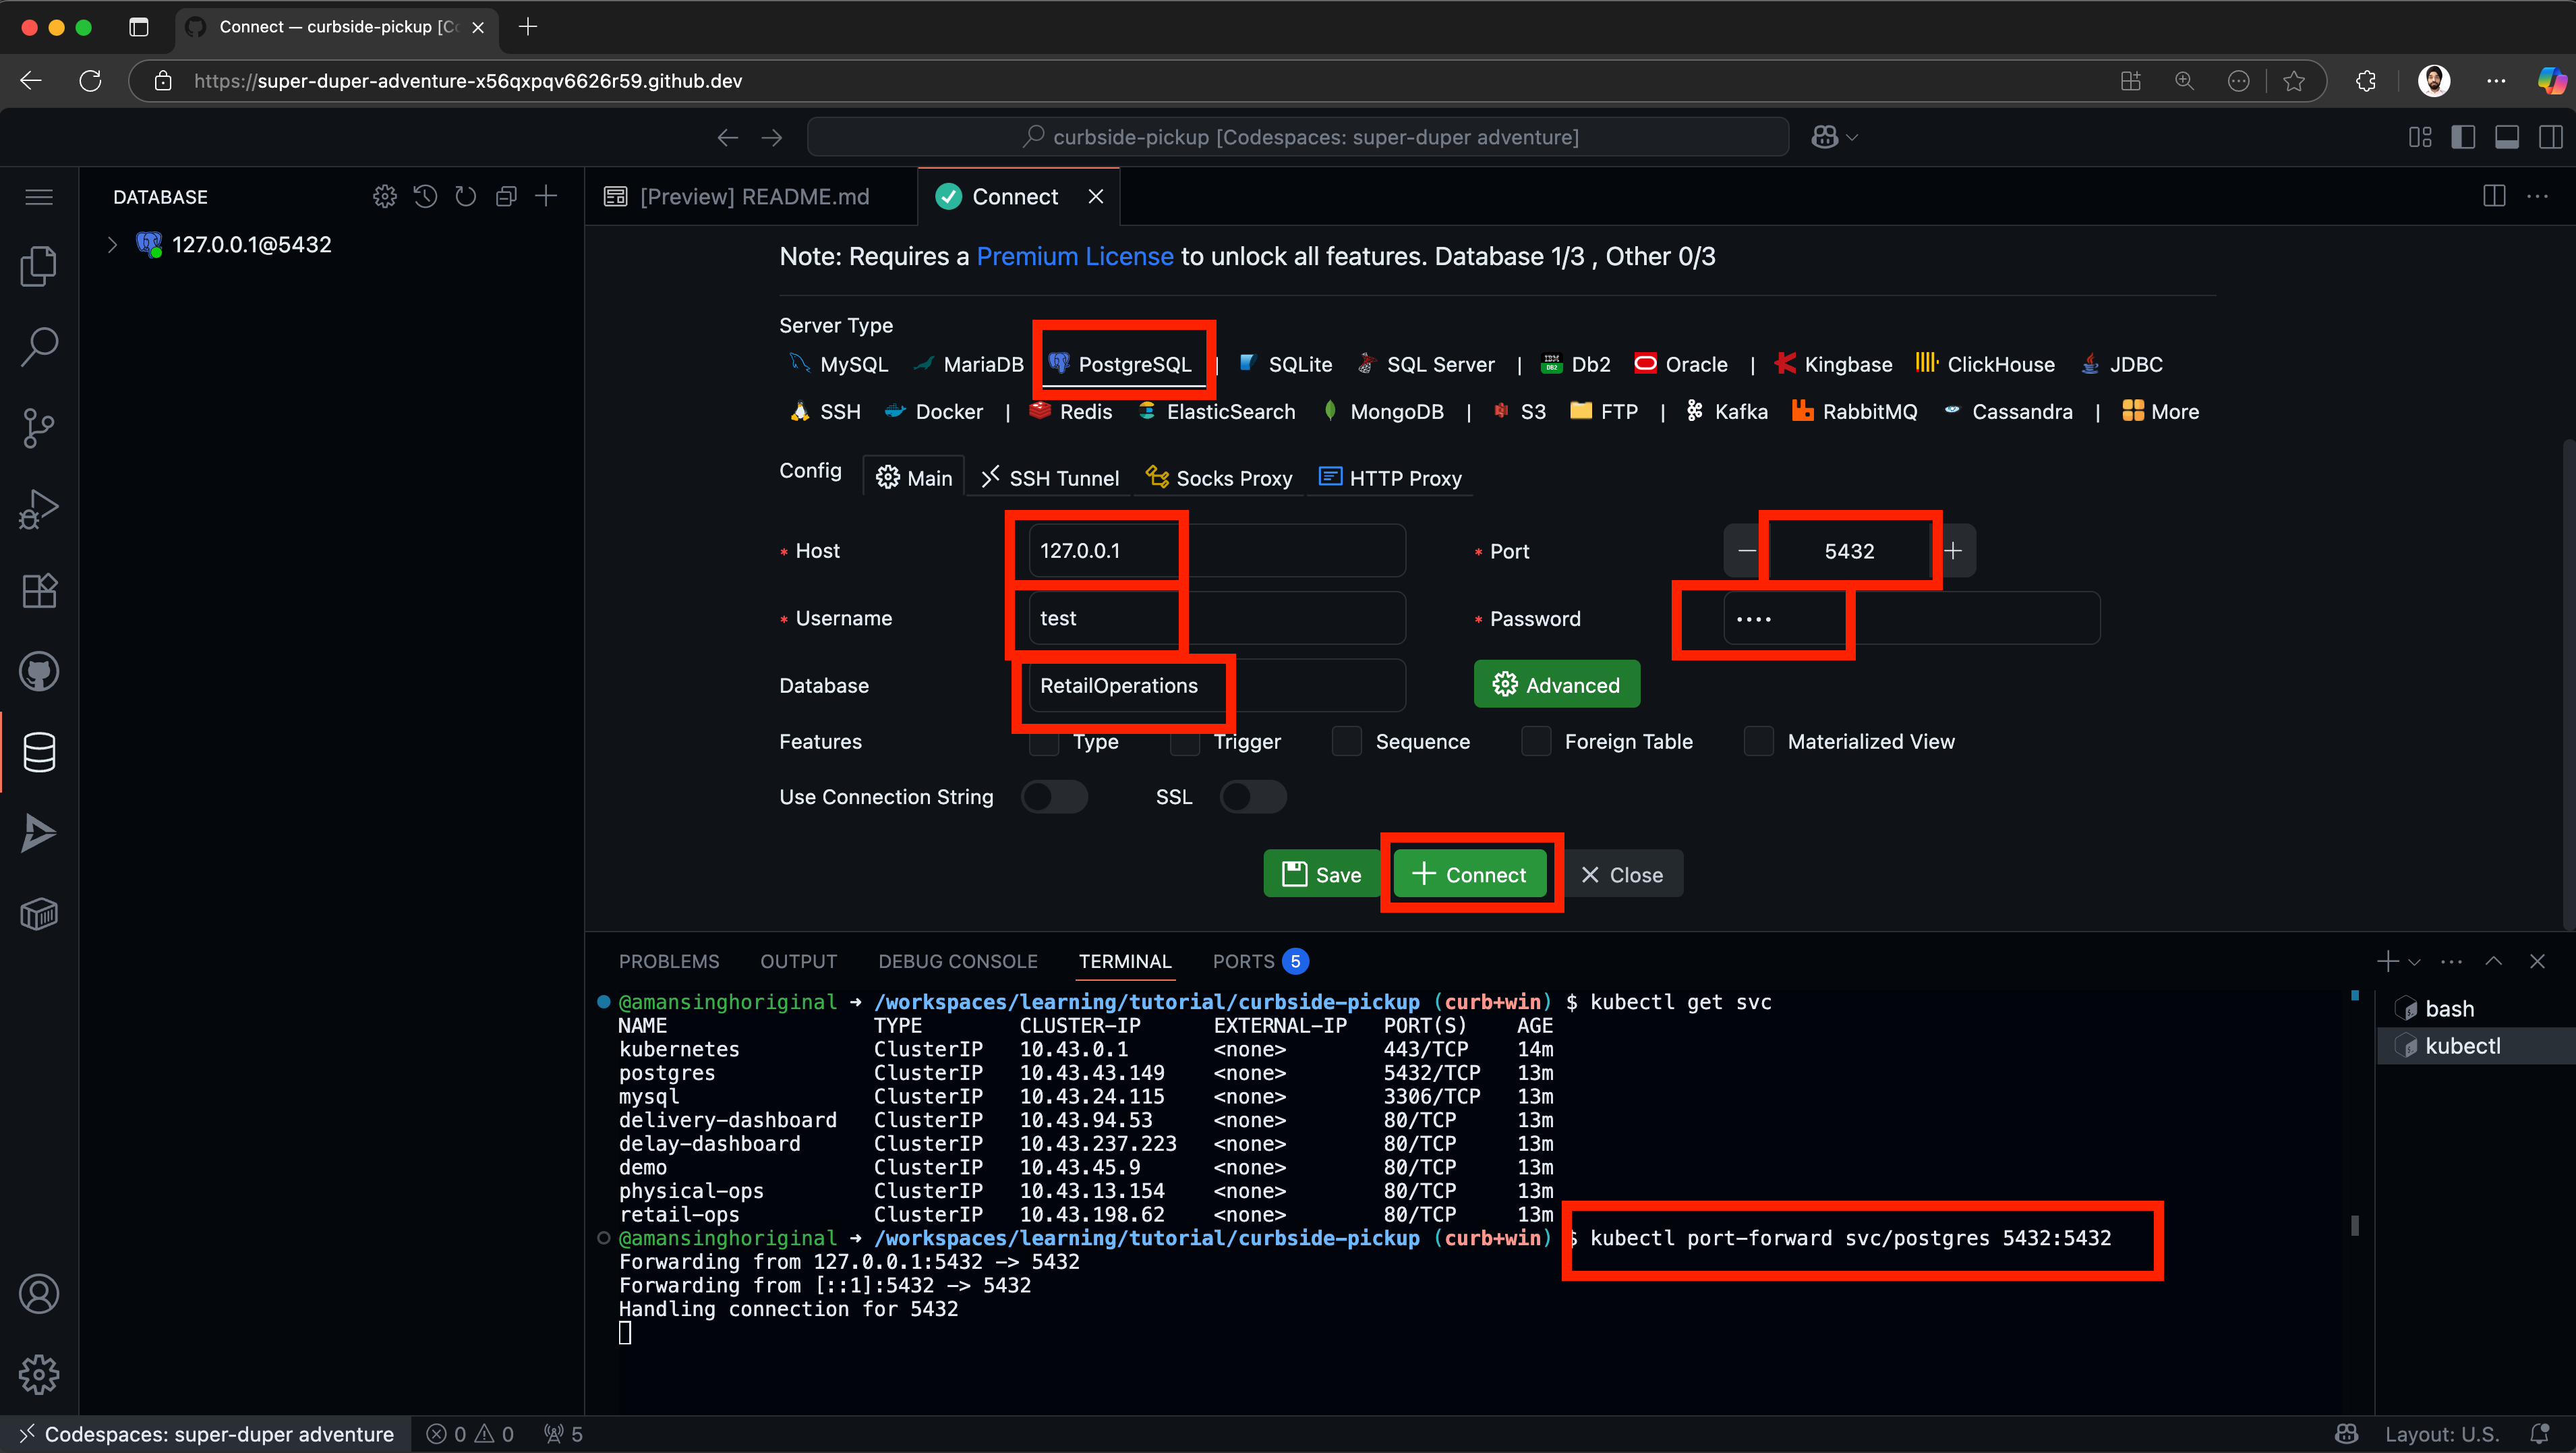
Note: For this to work, you must run a port-forward on the postgres service running on k3d.
If you want to look at the MySQL database, you may use CLI for your local setup. For codespaces and devcontainers, you can use the included extension like this:
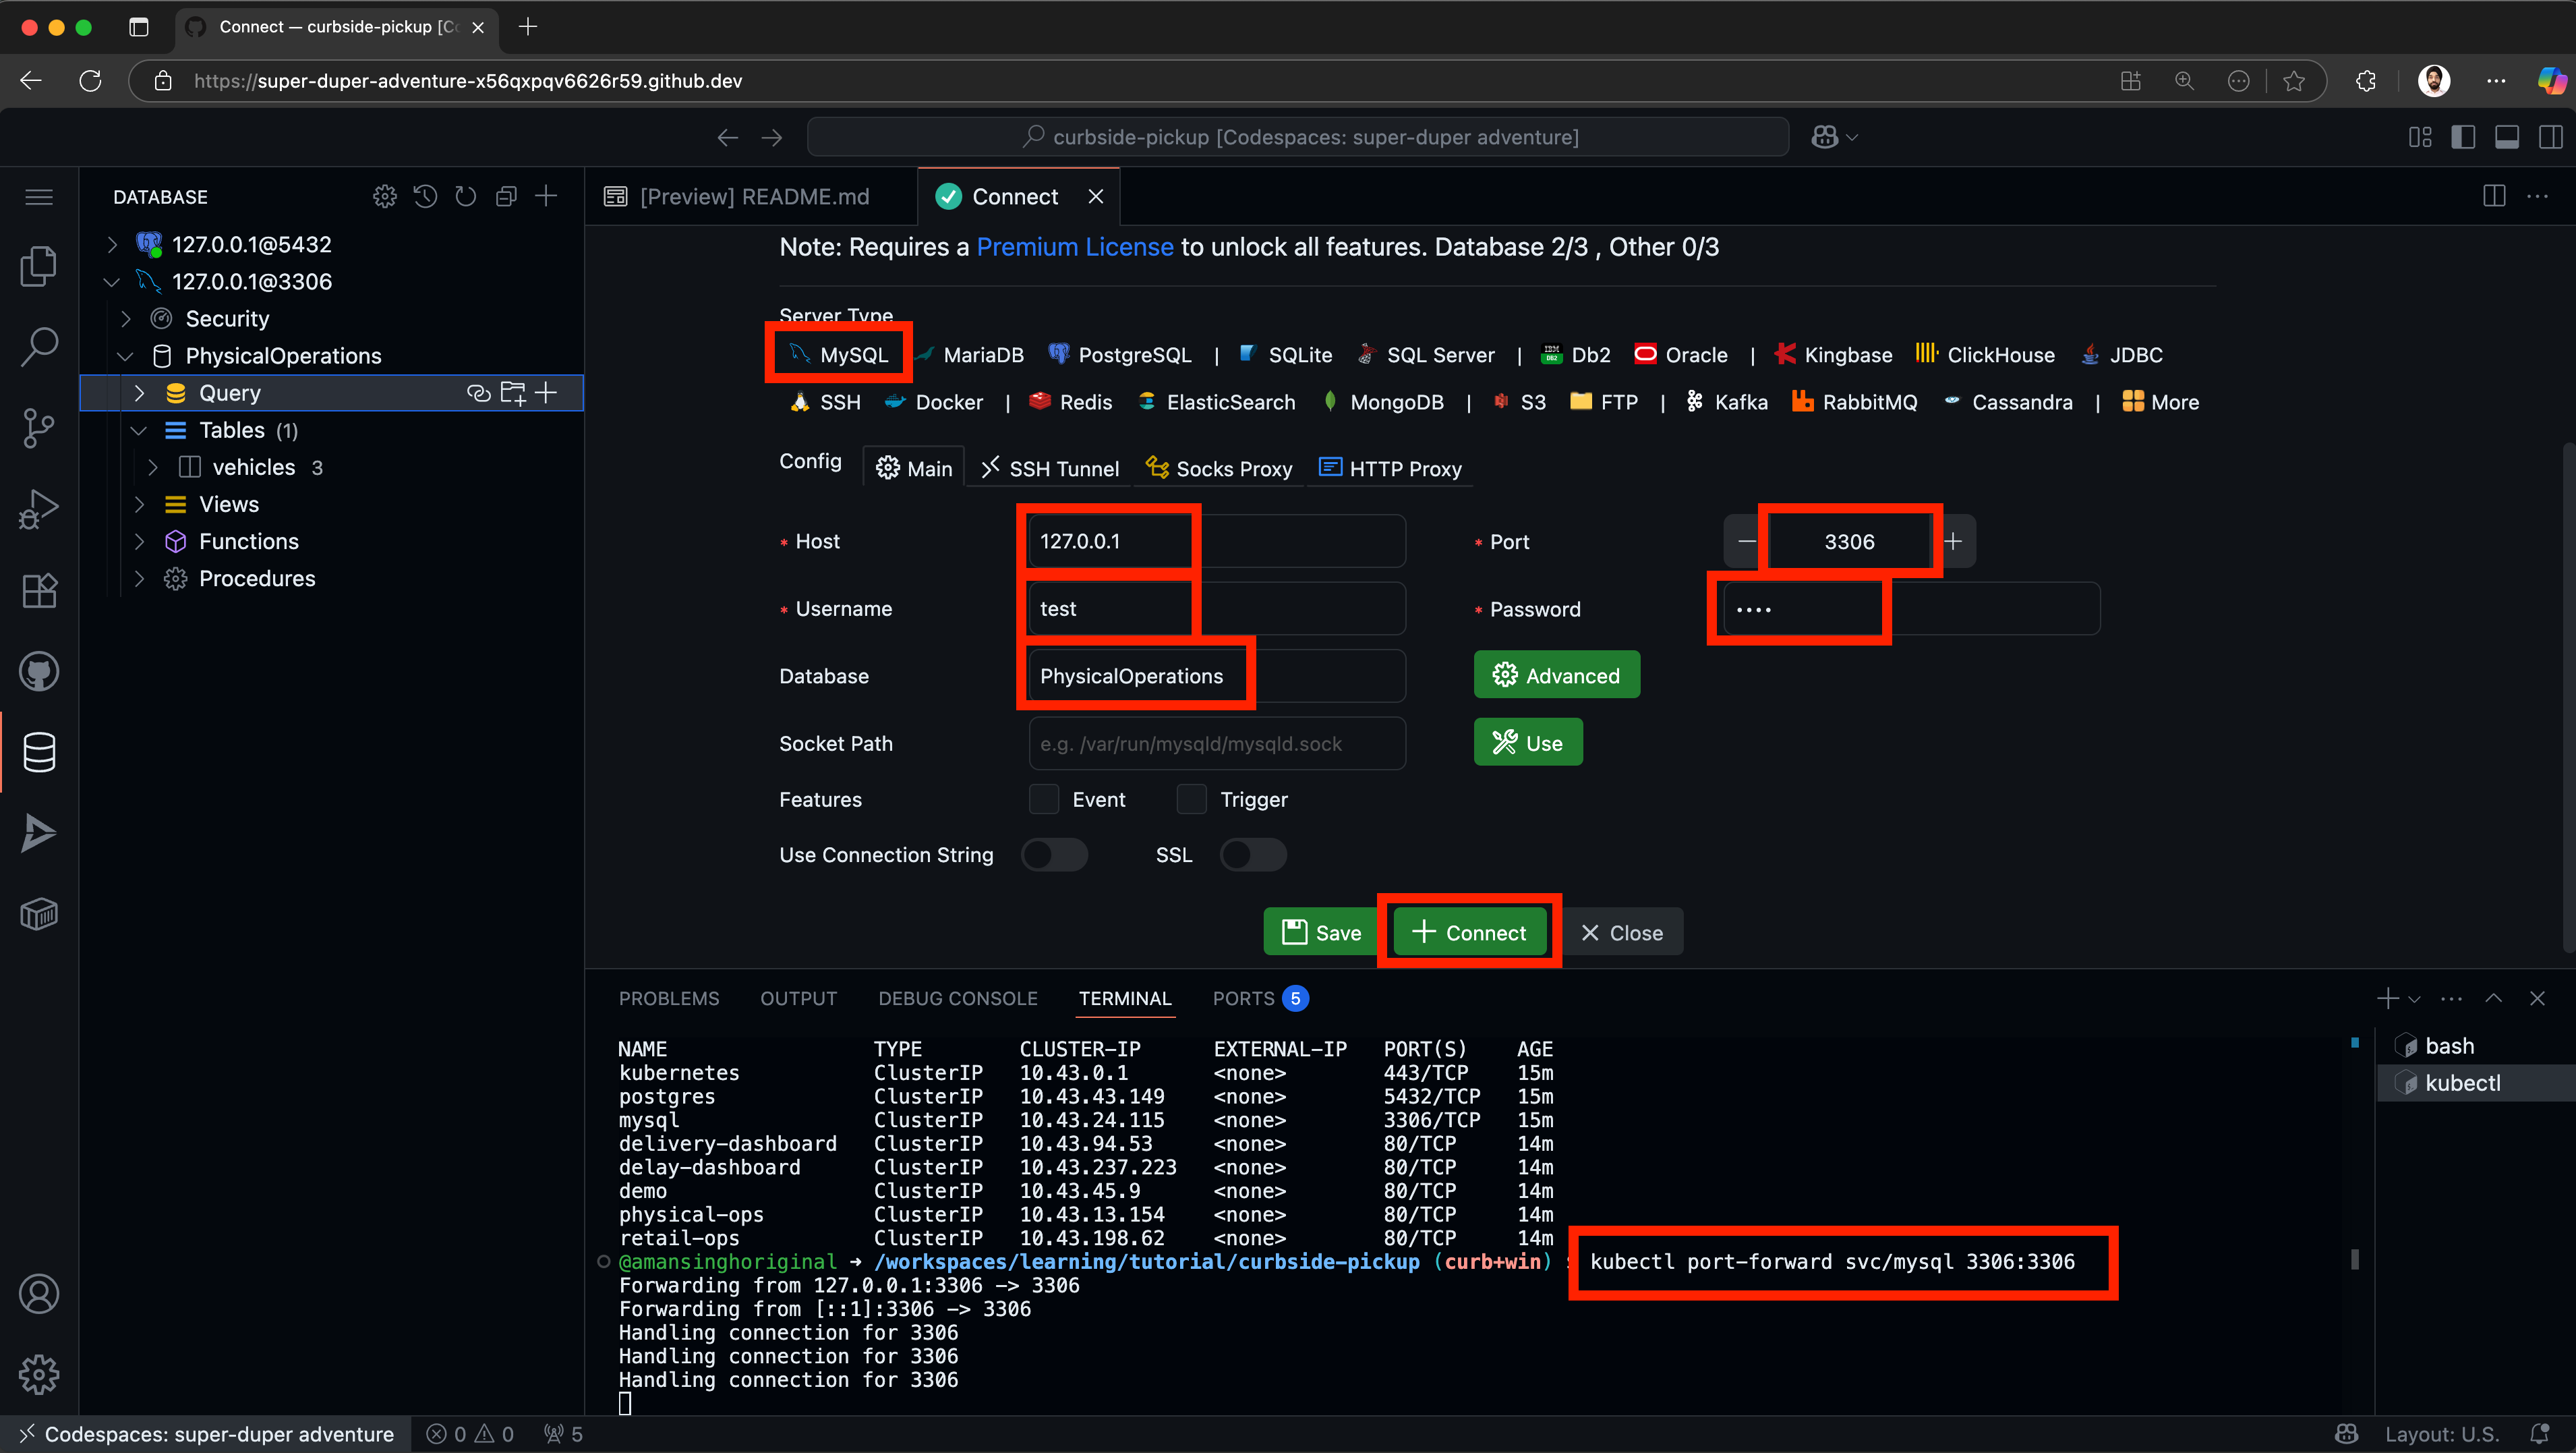
Note: For this to work, you must run a port-forward on the postgres service running on k3d.
Appendix: Live Debugging of Queries
If you are using the Drasi VSCode Extension, you can also live debug your queries. For instance if you have moved a few vehicles to curbside and marked matching orders as Ready, then click on the Debug button on the delivery query like shown here:
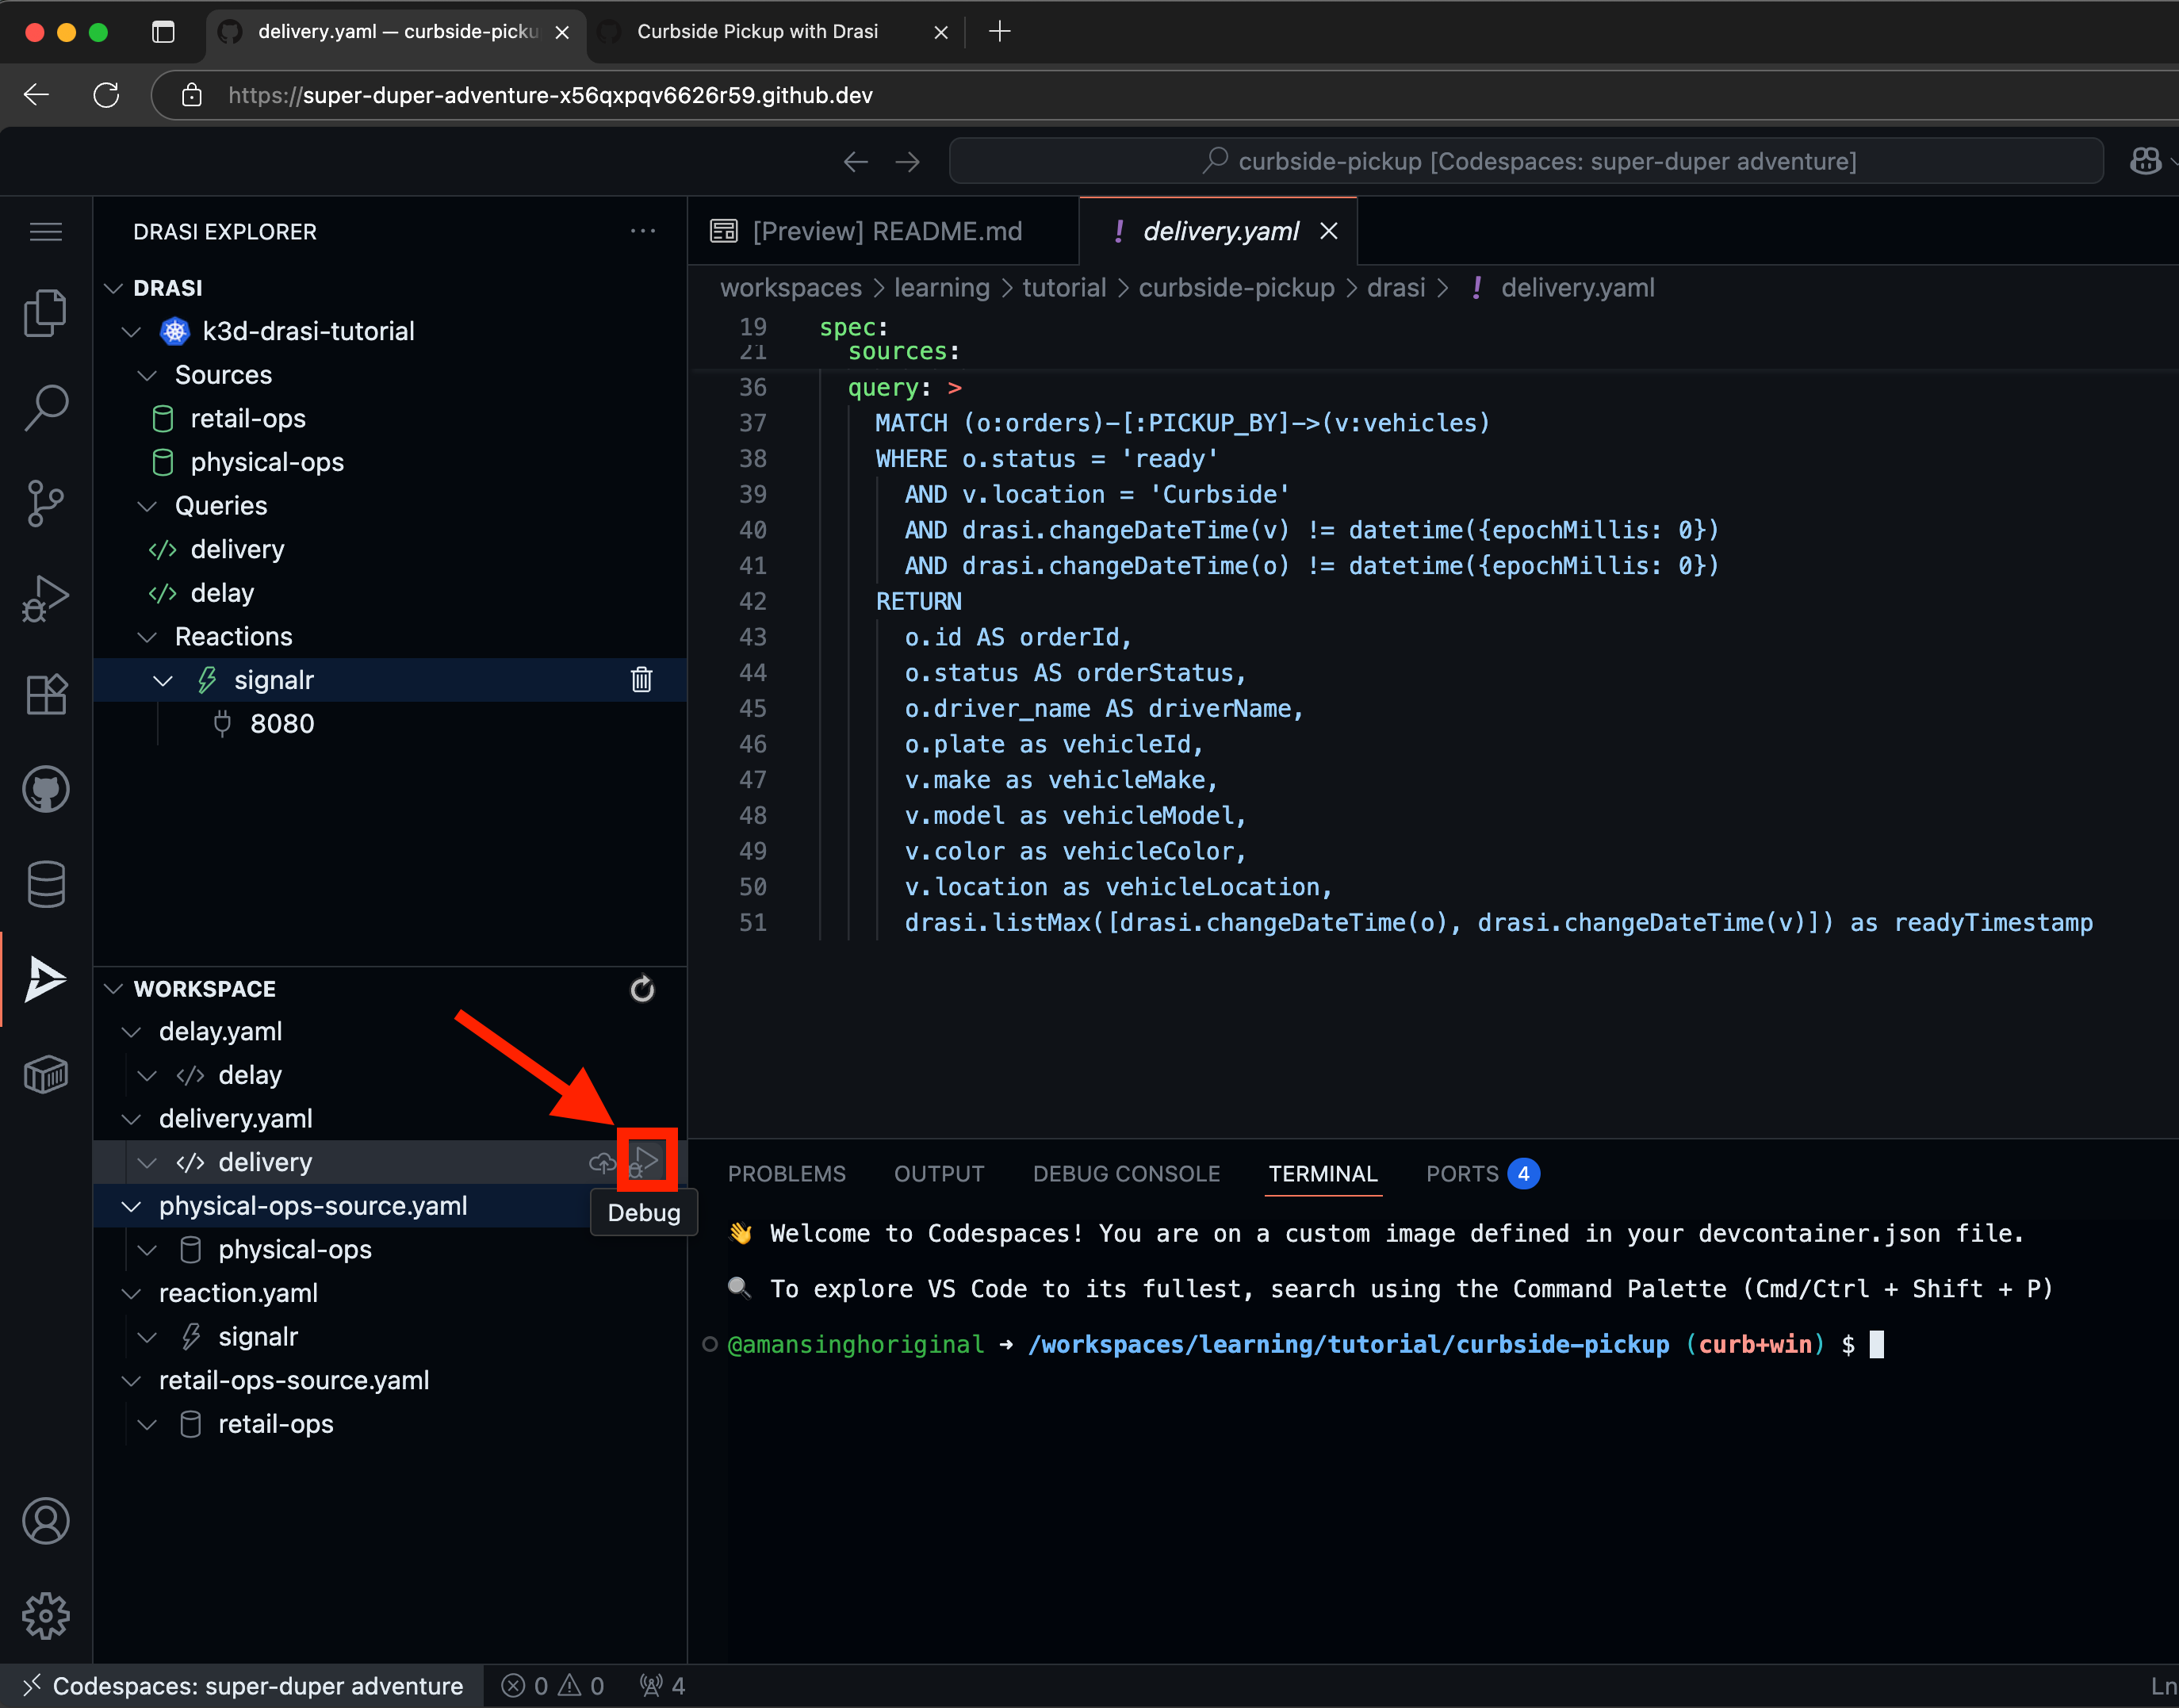
This will show you the live results of the query like this:
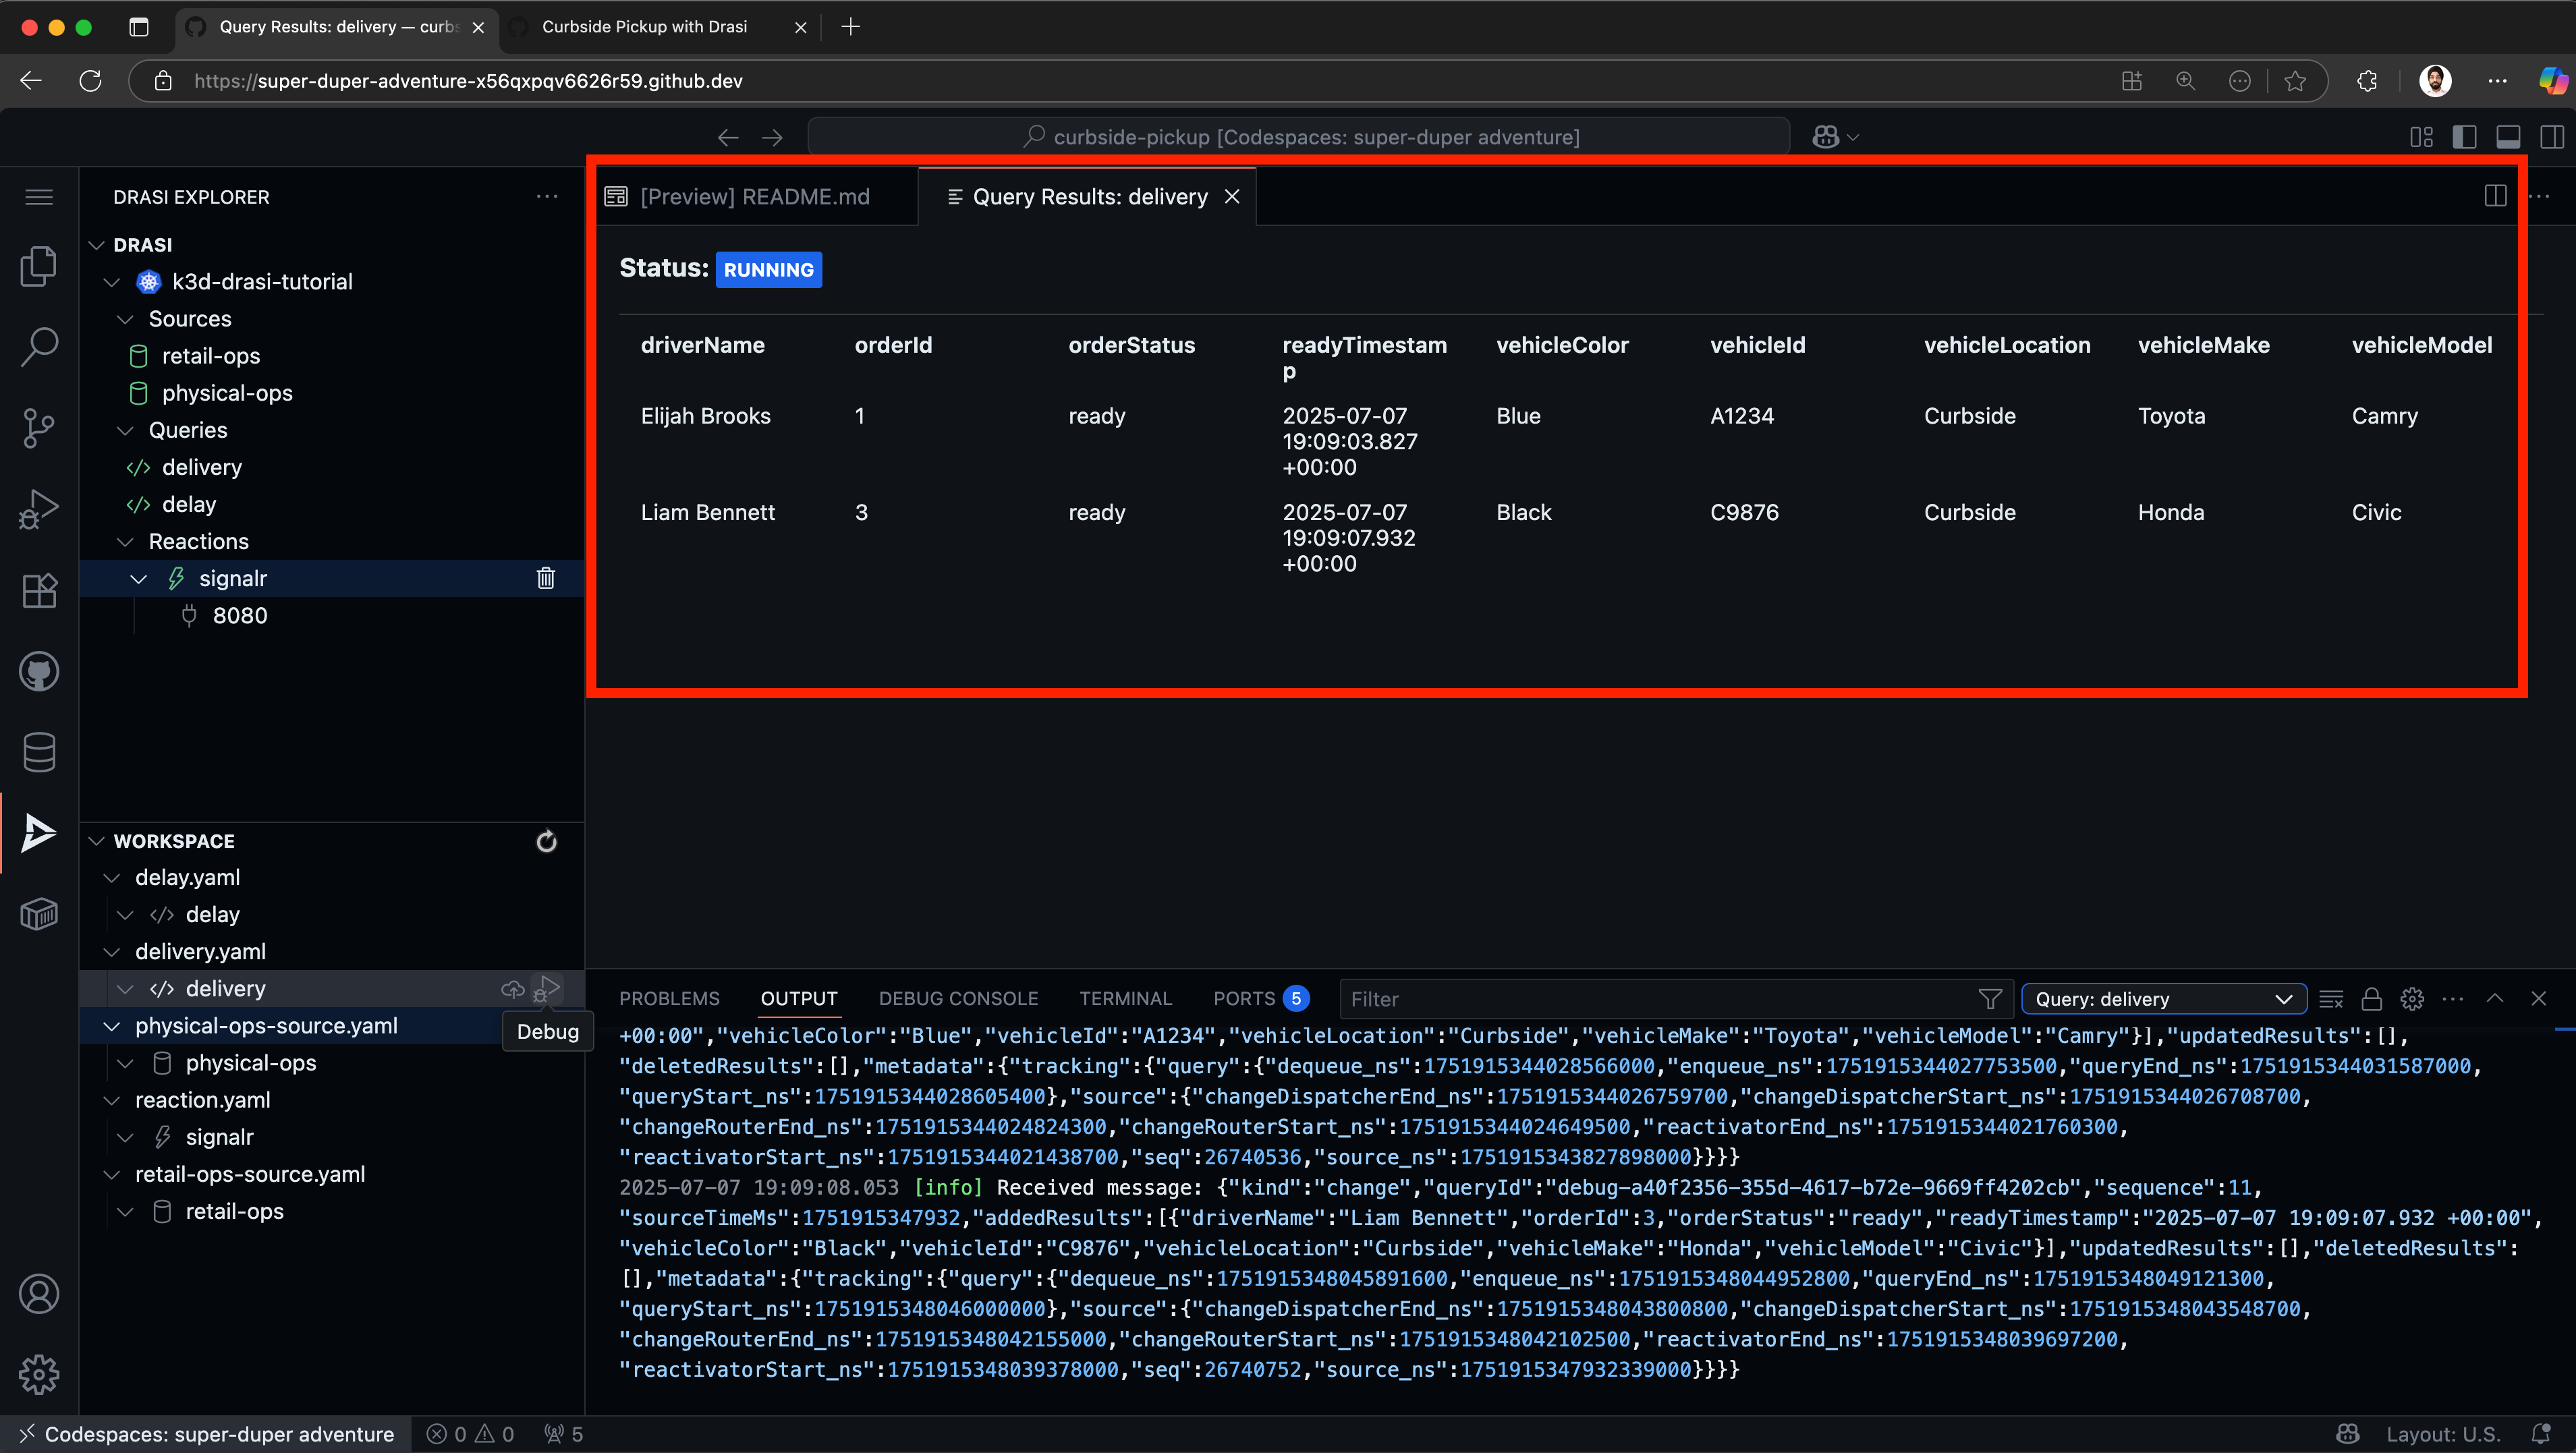
For CLI users, you can also use the drasi watch command on the terminal to achieve the same.
Appendix: App Code
- Delivery Dashboard (top-left): Real-time order matching.
- This app can be directly accessed by adding
/delivery-dashboardto the demo URL. - The code for this dashboard is available in the
tutorial/curbside-pickup/delivery-dashboarddirectory.
- This app can be directly accessed by adding
- Delay Dashboard (top-right): Identify extended wait times in real time.
- This app can be directly accessed by adding
/delay-dashboardto the demo URL. - The code for this dashboard is available in the
tutorial/curbside-pickup/delay-dashboarddirectory.
- This app can be directly accessed by adding
- Retail Operations (bottom-right): Simulate order management
- This app can be directly accessed by adding
/retail-opsto the demo URL. - The code for this dashboard is available in the
tutorial/curbside-pickup/retail-opsdirectory. - The API for this app is available at URL
/retail-ops/docs.
- This app can be directly accessed by adding
- Physical Operations (bottom-left): Simulate vehicle movement
- This app can be directly accessed by adding
/physical-opsto the demo URL. - The code for this dashboard is available in the
tutorial/curbside-pickup/physical-opsdirectory. - The API for this app is available at URL
/physical-ops/docs.
- This app can be directly accessed by adding
If you want to modify the applications, the tutorial includes helpful scripts:
Hot Reload for Development
macOS/Linux:
# Rebuild and deploy a specific app with your changes
cd tutorial/curbside-pickup
./scripts/dev-reload.sh retail-ops
Windows (PowerShell):
cd tutorial\curbside-pickup
.\scripts\dev-reload.ps1 retail-ops
This script:
- Builds a new Docker image from local source
- Imports it into the k3d cluster
- Updates the deployment to use your custom image
Reset to Official Images
macOS/Linux:
# Reset a single app
./scripts/reset-images.sh retail-ops

# Reset all apps
./scripts/reset-images.sh all
Windows (PowerShell):
# Reset a single app
.\scripts\reset-images.ps1 retail-ops

# Reset all apps
.\scripts\reset-images.ps1 all
Feedback
Was this page helpful?
Glad to hear it! Please tell us what you found helpful.
Sorry to hear that. Please tell us how we can improve.