Risky Containers
14 minute read
Scenario
In this tutorial, we will connect a PostgreSQL source with a Kubernetes source in order to create a Continuous Query that will join the two together. The PostgreSQL table will hold a list of container image tags that are considered high risk, and the query will join this table to the live Pods running in a Kubernetes cluster to create a real-time dashboard of running containers with an image tag that is marked as risky.
Tutorial Modes
You can follow along the steps below in a Github codespace, a VSCode Dev Container or your own Kubernetes environment.
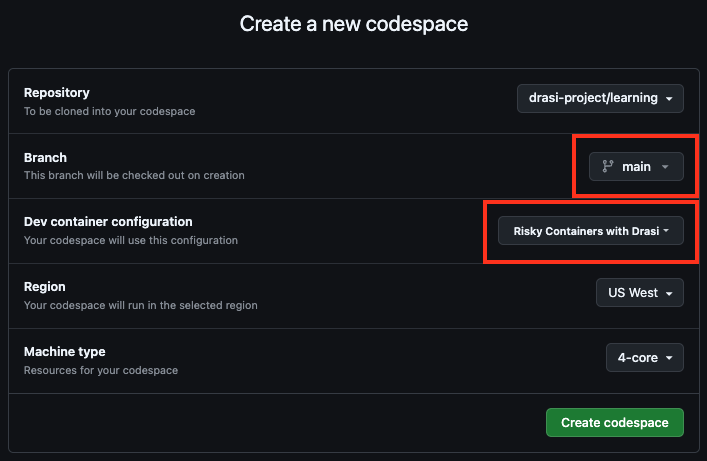
The easiest way to follow along with this tutorial is to launch a Github Codespace using the link below. This will allow you to run the example application within your browser without setting up anything on your own machines.
![]()
This will open a page with some configuration options. Make sure that the Branch selected is main and set the Dev Container configuration to Risky Containers with Drasi.
To follow along with a Dev Container, you will need to install:
- Visual Studio Code
- Visual Studio Code Dev Containers extension
- docker
Next, clone the learning repo from Github, and open the repo in VS Code. Make sure that Docker daemon (or Docker Desktop) is running.
Once the solution is open in VS Code, follow these steps:
- Press Cmd + Shift + P (on MacOS) or Ctrl + Shift + P (Windows or Linux) to launch the command palette.
- Select
Dev Containers: Rebuild and Reopen in Container. - Select the
Risky Containers with Drasioption to launch this tutorial.
Recommended Docker Resources
For optimal performance with the Drasi Dev Container, we recommend configuring Docker with the following minimum resources:
- CPU: 3 cores or more
- Memory: 4 GB or more
- Swap: 1 GB or more
- Disk: 50 GB available space
To adjust these settings in Docker Desktop:
- Open Docker Desktop
- Go to Settings (gear icon)
- Navigate to “Resources” → “Advanced”
- Adjust the sliders to meet or exceed the recommended values
- Click “Apply & Restart”
You need to have your own Kubernetes cluster setup. You can use any Kubernetes setup. For a local testing setup, you can choose one of alternatives like Kind, Minikube or k3d.
Make sure that kubectl on your system points to your Kubernetes cluster.
You will need the PostgreSQL CLI tool
You will need to deploy PostgreSQL to your cluster. The following command can be used, it will also create the table and data required for this tutorial.
kubectl apply -f ./resources/postgres.yaml
kubectl wait --for=condition=ready pod -l app=postgres --timeout=60s
If you are not using the GitHub codespace or VS Code dev container, you will need to open a port forward to access the PostgreSQL instance.
kubectl port-forward services/postgres 5432:5432
Drasi VSCode Extension
We also have a VSCode extension for Drasi, which can make it easy to debug and deploy Drasi components. Although this is not required, you can use this during our tutorial if you want a terminal-free experience.
Your codespace already has the Drasi extension installed.
Your dev container already has the Drasi extension installed.
You can install the VSCode Extension by following the instructions here.
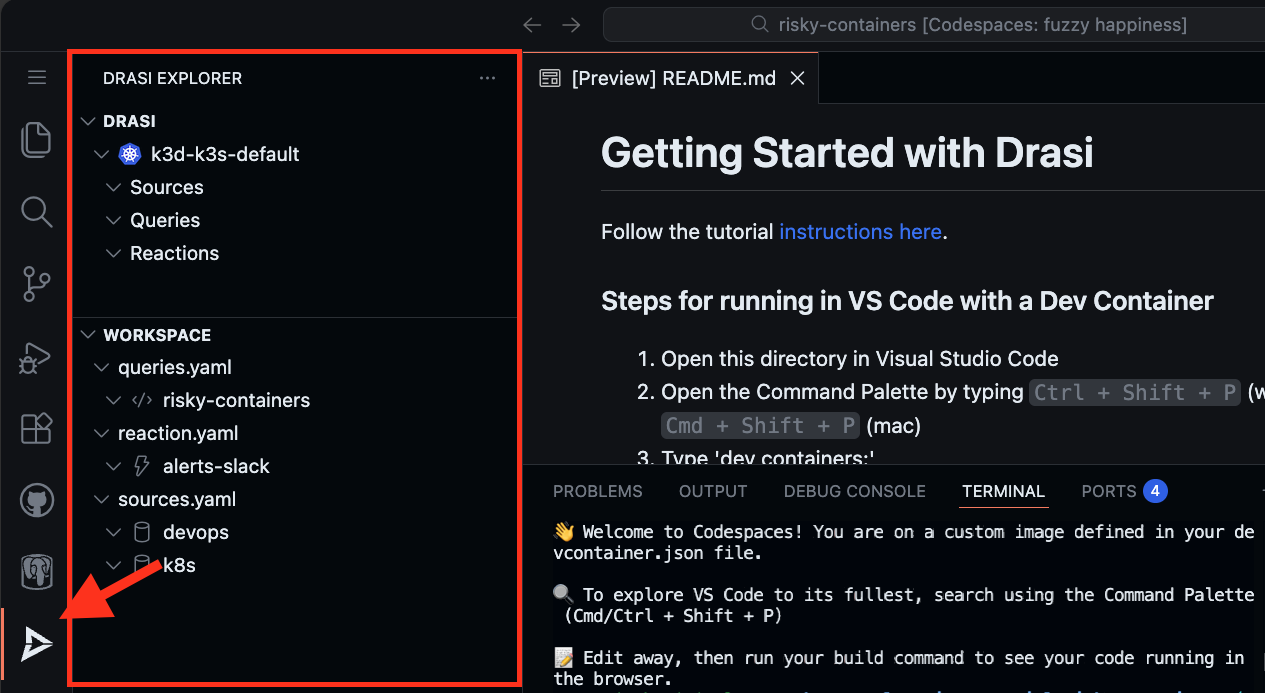
Note: If you are using VSCode and installing the extension, it is recommended to open the folder learning/tutorial/risky-containers in VSCode.
This is because the extension automatically lists all the Drasi YAMLs found in your workspace and the screenshots in the rest of this tutorial assume the set of YAMLs within the path mentioned earlier.
PostgreSQL Table
A PostgreSQL table named RiskyImage has been pre-loaded with the following data:
| Id | Image | Reason | Mitigation |
|---|---|---|---|
| 1 | ghcr.io/drasi-project/my-app:0.1 | Security Risk | Update to latest version |
| 2 | docker.io/library/redis:6.2.3-alpine | Compliance Issue | Use official image |
You can view this data by connecting to the PostgreSQL instance.
psql
Then run the following SQL query:
select * from "RiskyImage";
Deploy Pods
The following command will deploy two Pods of my-app, one with version 0.1 and one with version 0.2.
kubectl apply -f ./resources/my-app.yaml
Store Kubernetes credentials in a secret
Before we can create a Kubernetes source, we need the credentials of the cluster that the source will connect to. The way to get these credentials will differ depending on how you are running Kubernetes. The scripts below will extract the credentials of your current Kubernetes context and store them in a secret, to be referenced by the Drasi Kubernetes source.
If you are running using Github Codespaces or the VS code dev container, then use the
k3dscript.
k3d kubeconfig get k3s-default | sed 's/0.0.0.0.*/kubernetes.default.svc/g' | kubectl create secret generic k8s-context --from-file=context=/dev/stdin -n drasi-system
kind get kubeconfig | sed 's/127.0.0.1.*/kubernetes.default.svc/g' | kubectl create secret generic k8s-context --from-file=context=/dev/stdin -n drasi-system
az aks get-credentials --resource-group <resource-group> --name <cluster-name> --file - | kubectl create secret generic k8s-context --from-file=context=/dev/stdin -n drasi-system
Deploy the sources
Next we need to connect Drasi to both the PostgreSQL database and the Kubernetes cluster. The sources are defined in drasi/sources.yaml:
apiVersion: v1
kind: Source
name: devops
spec:
  kind: PostgreSQL
  properties:
    host: postgres.default.svc.cluster.local
    user: test
    port: 5432
    ssl: false
    password: test
    database: tutorial
    tables:
      - public.RiskyImage
---
apiVersion: v1
kind: Source
name: k8s
spec:
  kind: Kubernetes
  properties:
    kubeConfig:
      kind: Secret
      name: k8s-context
      key: context
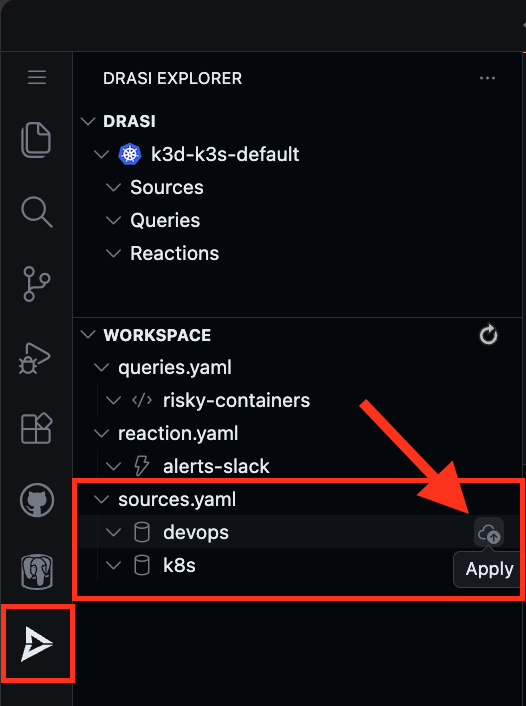
Find the sources in the Workspace inside Drasi VSCode Extension and click “Apply” for each source (devops and k8s).
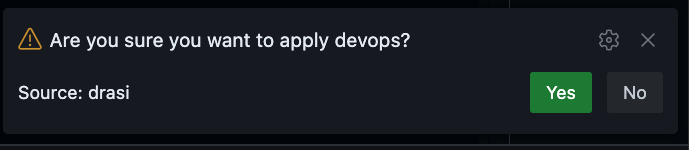
You will get a pop-up on the bottom right corner of your screen. Confirm if you want to deploy the source.
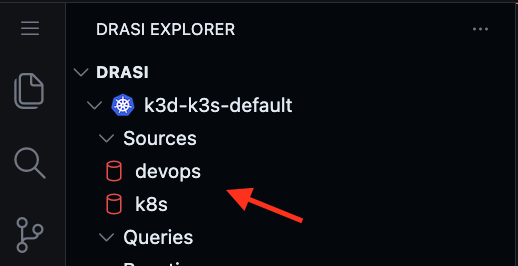
Both sources will start showing up in the Drasi explorer with a Red Icon indicating that they are bootstrapping.
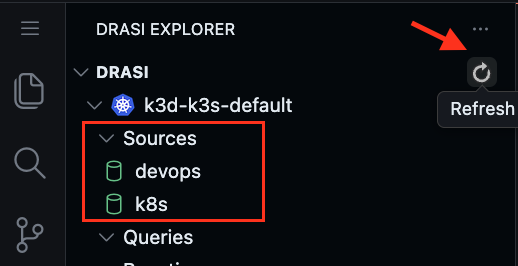
Wait for a couple minutes for both sources to show a Green icon indicating they are ready. You can also click on Refresh button to get latest status.
Deploy the sources:
drasi apply -f ./drasi/sources.yaml
Wait for the sources to be ready (this may take a few minutes):
drasi wait -f ./drasi/sources.yaml -t 180
Verify the sources are online:
drasi list source
Both sources must be listed with AVAILABLE set to true:
    ID   | AVAILABLE | INGRESS URL | MESSAGES
---------+-----------+-------------+-----------
  devops | true      |             |
  k8s    | true      |             |
Deploy Continuous Query
Next, we will create a Continuous Query that will join the rows in the RiskyImage table to Pods that are running inside the Kubernetes cluster. The Kubernetes source will create graph nodes that match the Kubernetes API. The container information that we are interested in is nested in this object in the status.containerStatuses array. We are looking to use the image property on the entries in this array to join to the Image column of the RiskyImages table.
Here is a sample of the Pod payload from the Kubernetes API.
{
    "apiVersion": "v1",
    "kind": "Pod",
    "metadata": {
        "creationTimestamp": "2024-12-18T20:00:13Z",
        "name": "my-app-1",
        "namespace": "default"
    },
    "spec": ...,
    "status": {
        "conditions": [
          ...
        ],
        "containerStatuses": [
            {
                "containerID": "containerd://...",
                "image": "ghcr.io/drasi-project/my-app:0.1",
                "name": "app",
                "ready": true,
                "restartCount": 0,
                "started": true,
                "state": {
                    "running": {
                        "startedAt": "2024-12-18T20:00:19Z"
                    }
                }
            }
        ]
    }
}
In order to extract the containers in this array and promote them to top level graph nodes, we will use the unwind middleware. This middleware will pre-process incoming changes by extracting each entry in the containerStatuses array and promoting it to a node with the label of Container. It will use the container name as a unique key for the container within the scope of the parent Pod and it will create a graph relation between them with the label of OWNS. The Container nodes can now be used in a synthetic join with the RiskyImage table by creating the HAS_IMAGE relation.
The query is defined in drasi/queries.yaml:
apiVersion: v1
kind: ContinuousQuery
name: risky-containers
spec:
  mode: query
  sources:
    subscriptions:
      - id: k8s # Kubernetes cluster
        nodes:
          - sourceLabel: Pod
        pipeline:
          - extract-containers
      - id: devops  # PostgreSQL Database
        nodes:
          - sourceLabel: RiskyImage
    joins:
        # The relation name of the synthetic join
      - id: HAS_IMAGE
        keys:
            # The label of the PostgreSQL table
          - label: RiskyImage
            property: Image
            # The label of the Container entries extracted from the Pod
          - label: Container
            property: image
    middleware:
      - kind: unwind
        name: extract-containers
        # The incoming element label to unwind from
        Pod:
            # The JsonPath location of the field on the parent element to unwind.
          - selector: $.status.containerStatuses[*]
            # The label of the nodes that will be creating from this array.
            label: Container
            # A unique identifier for each container within the scope of the Pod
            key: $.name
            # The label of the relation that joins the parent Pod to the child Container
            relation: OWNS

  query: >
    MATCH
      (p:Pod)-[:OWNS]->(c:Container)-[:HAS_IMAGE]->(i:RiskyImage)
    RETURN
      p.metadata.name as pod,
      p.metadata.namespace as namespace,
      c.image as image,
      c.name as name,
      i.Reason as reason,
      i.Mitigation as mitigation
Note the key changes in this query:
key: $.name: Uses the container name as the unique identifierp.metadata.name: Accesses the pod name from the Kubernetes metadata objectp.metadata.namespace: Includes the namespace for better identificationi.Mitigation: Returns the mitigation guidance for each risky image
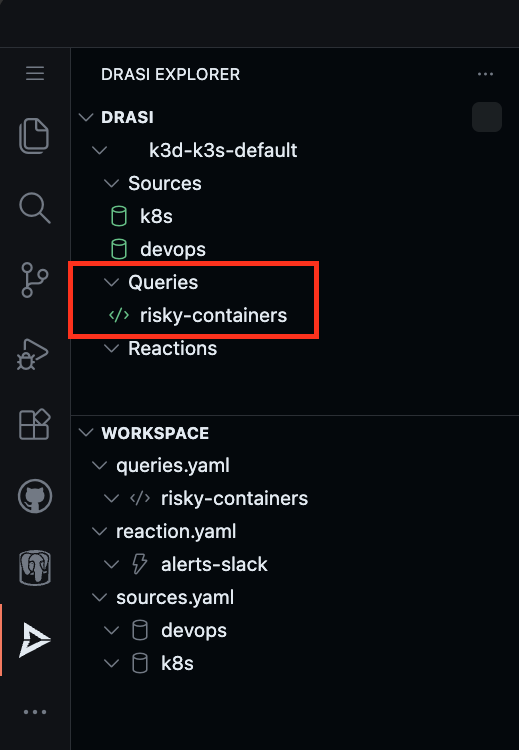
Find the query risky-containers in the Workspace inside Drasi VSCode Extension and click “Apply”.
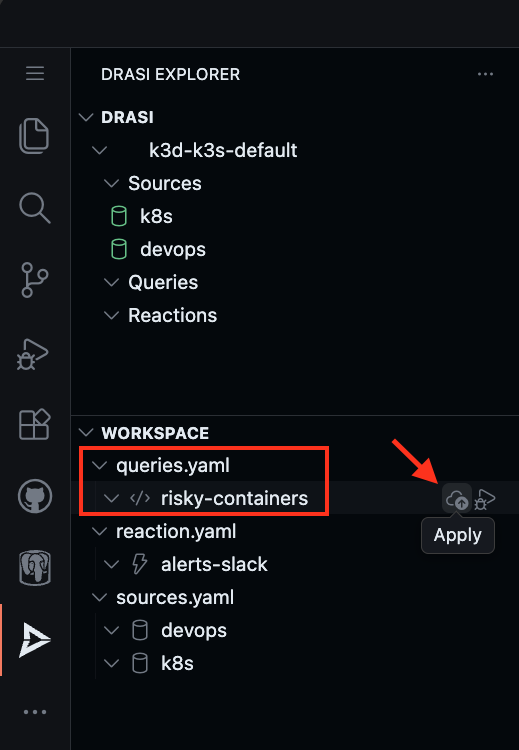
Confirm the deployment when prompted. Wait for the query to show a Green icon indicating it is ready.
Deploy the query:
drasi apply -f ./drasi/queries.yaml
Wait for the query to be ready (this may take a few minutes):
drasi wait -f ./drasi/queries.yaml -t 180
Verify the query is running:
drasi list query
The query should show STATUS as Running:
         ID        | CONTAINER | ERRORMESSAGE |              HOSTNAME               | STATUS
-------------------+-----------+--------------+-------------------------------------+----------
  risky-containers | default   |              | default-query-host-xxxx-xxxx        | Running
Watch Query Results
To observe the live result set of your continuous query, you can use either the VSCode Extension or the Drasi CLI watch command.
The VS Code extension Drasi explorer can be used to attach to the query to monitor it in realtime.
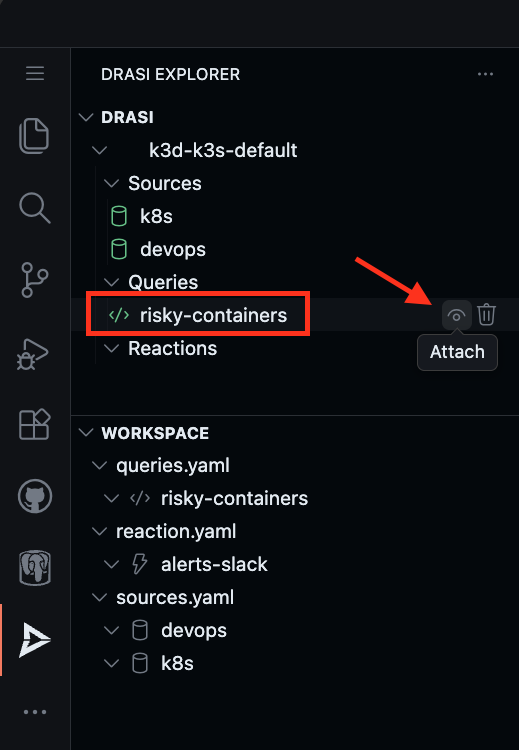
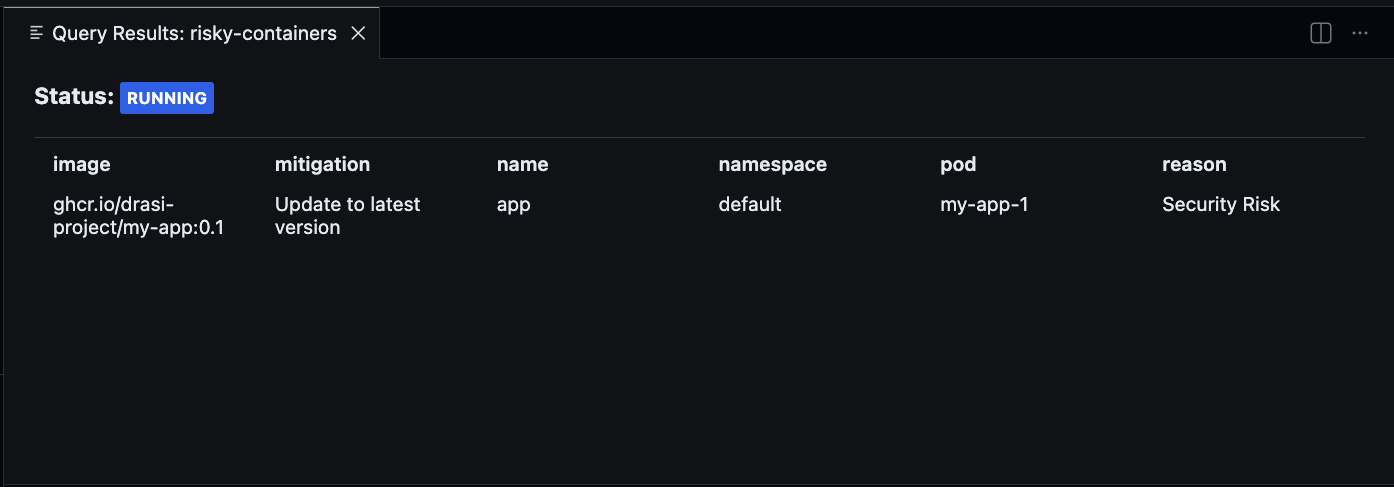
You should see the current result set of the query which lists my-app:0.1 as a Security Risk with the mitigation “Update to latest version”.
Keep this debug window open - you will use it to observe changes in the following sections.
The drasi watch command allows you to continuously monitor the result set of a query in real-time.
Open a new terminal and run:
drasi watch risky-containers
This opens an interactive terminal UI showing the live result set. You should see my-app-1 listed as a risky container:
Note: Column order and widths adjust to your terminal size. Use arrow keys to scroll if content is truncated. Press
qto exit. You can keep this running if you want and observe changes in the result set as you follow the steps in the following sections.
┌──────────────────────────────────────────────────────────────────────────────┐
│ mitigation            name   namespace   pod        reason        image      │
│──────────────────────────────────────────────────────────────────────────────│
│ Update to latest ve…  app    default     my-app-1   Security Risk ghcr.io/…  │
└──────────────────────────────────────────────────────────────────────────────┘
Use Arrow keys to navigate, Page Up/Down, Home/End to scroll, and q to exit.
Add a new High Risk Image Tag
Next, we will add a row to the RiskyImage table that marks my-app:0.2 as having a Critical Bug.
Connect to the PostgreSQL instance in another terminal:
psql
Then run the following SQL script:
insert into "RiskyImage" ("Id", "Image", "Reason", "Mitigation") values (101, 'ghcr.io/drasi-project/my-app:0.2', 'Critical Bug', 'Update to latest version');
You should now also see my-app:0.2 in the query results, along with the mitigation guidance.
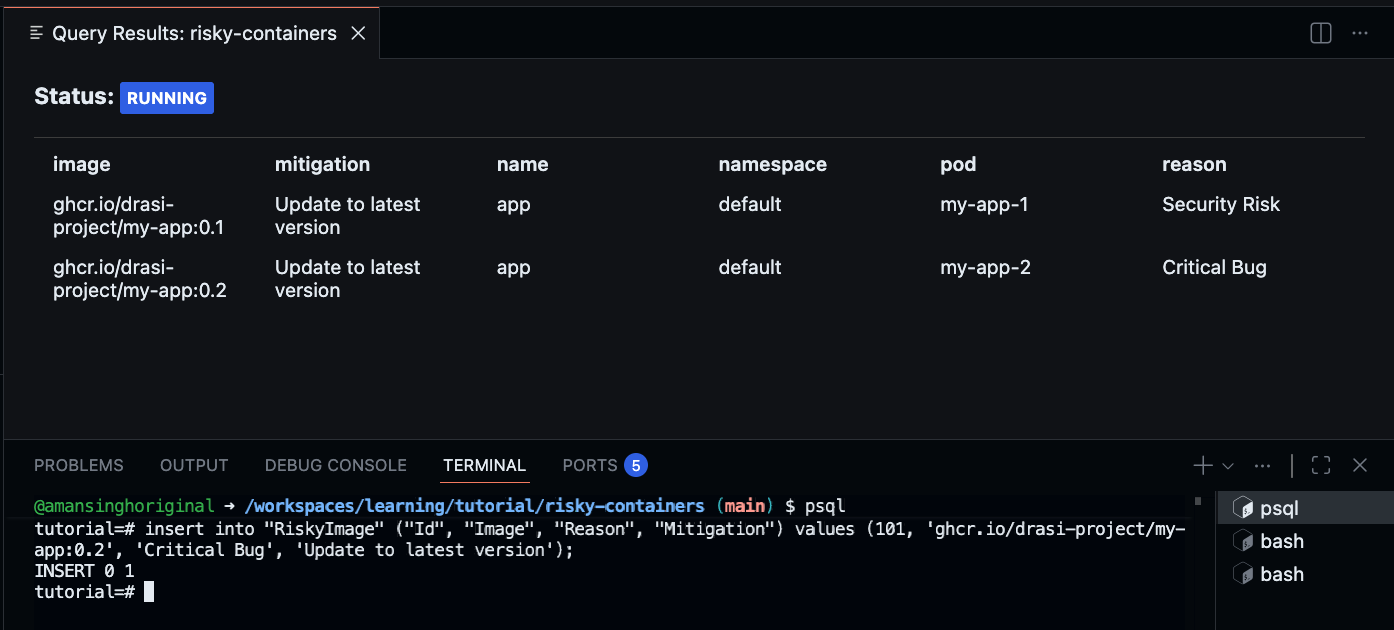
The drasi watch output should now show two entries:
┌──────────────────────────────────────────────────────────────────────────────┐
│ image                 mitigation            name   namespace   pod        …  │
│──────────────────────────────────────────────────────────────────────────────│
│ ghcr.io/drasi-proje…  Update to latest ve…  app    default     my-app-1   …  │
│ ghcr.io/drasi-proje…  Update to latest ve…  app    default     my-app-2   …  │
└──────────────────────────────────────────────────────────────────────────────┘
Use Arrow keys to navigate, Page Up/Down, Home/End to scroll, and q to exit.
The first row shows my-app-1 with reason “Security Risk” and the second shows my-app-2 with reason “Critical Bug”.
Upgrade a Pod to a non-high risk tag
Next, we will use kubectl to upgrade the Pod from version 0.2 to 0.3, which will make it disappear from the result set.
kubectl set image pod/my-app-2 app=ghcr.io/drasi-project/my-app:0.3
kubectl wait --for=condition=Ready pod/my-app-2 --timeout=60s
Once the pod is ready with the new image, you will see the my-app-2 row disappear from the query result set.
Optional: Slack Alerts
Note: This section is optional and requires a Slack workspace where you have permission to create incoming webhooks. Skip this section if you don’t have access to Slack or prefer not to set up external integrations.
In addition to viewing risky containers in a dashboard, you can configure Drasi to send real-time alerts to a Slack channel whenever a risky container is detected or resolved.
Create a Slack Incoming Webhook
- Go to your Slack workspace’s App Directory
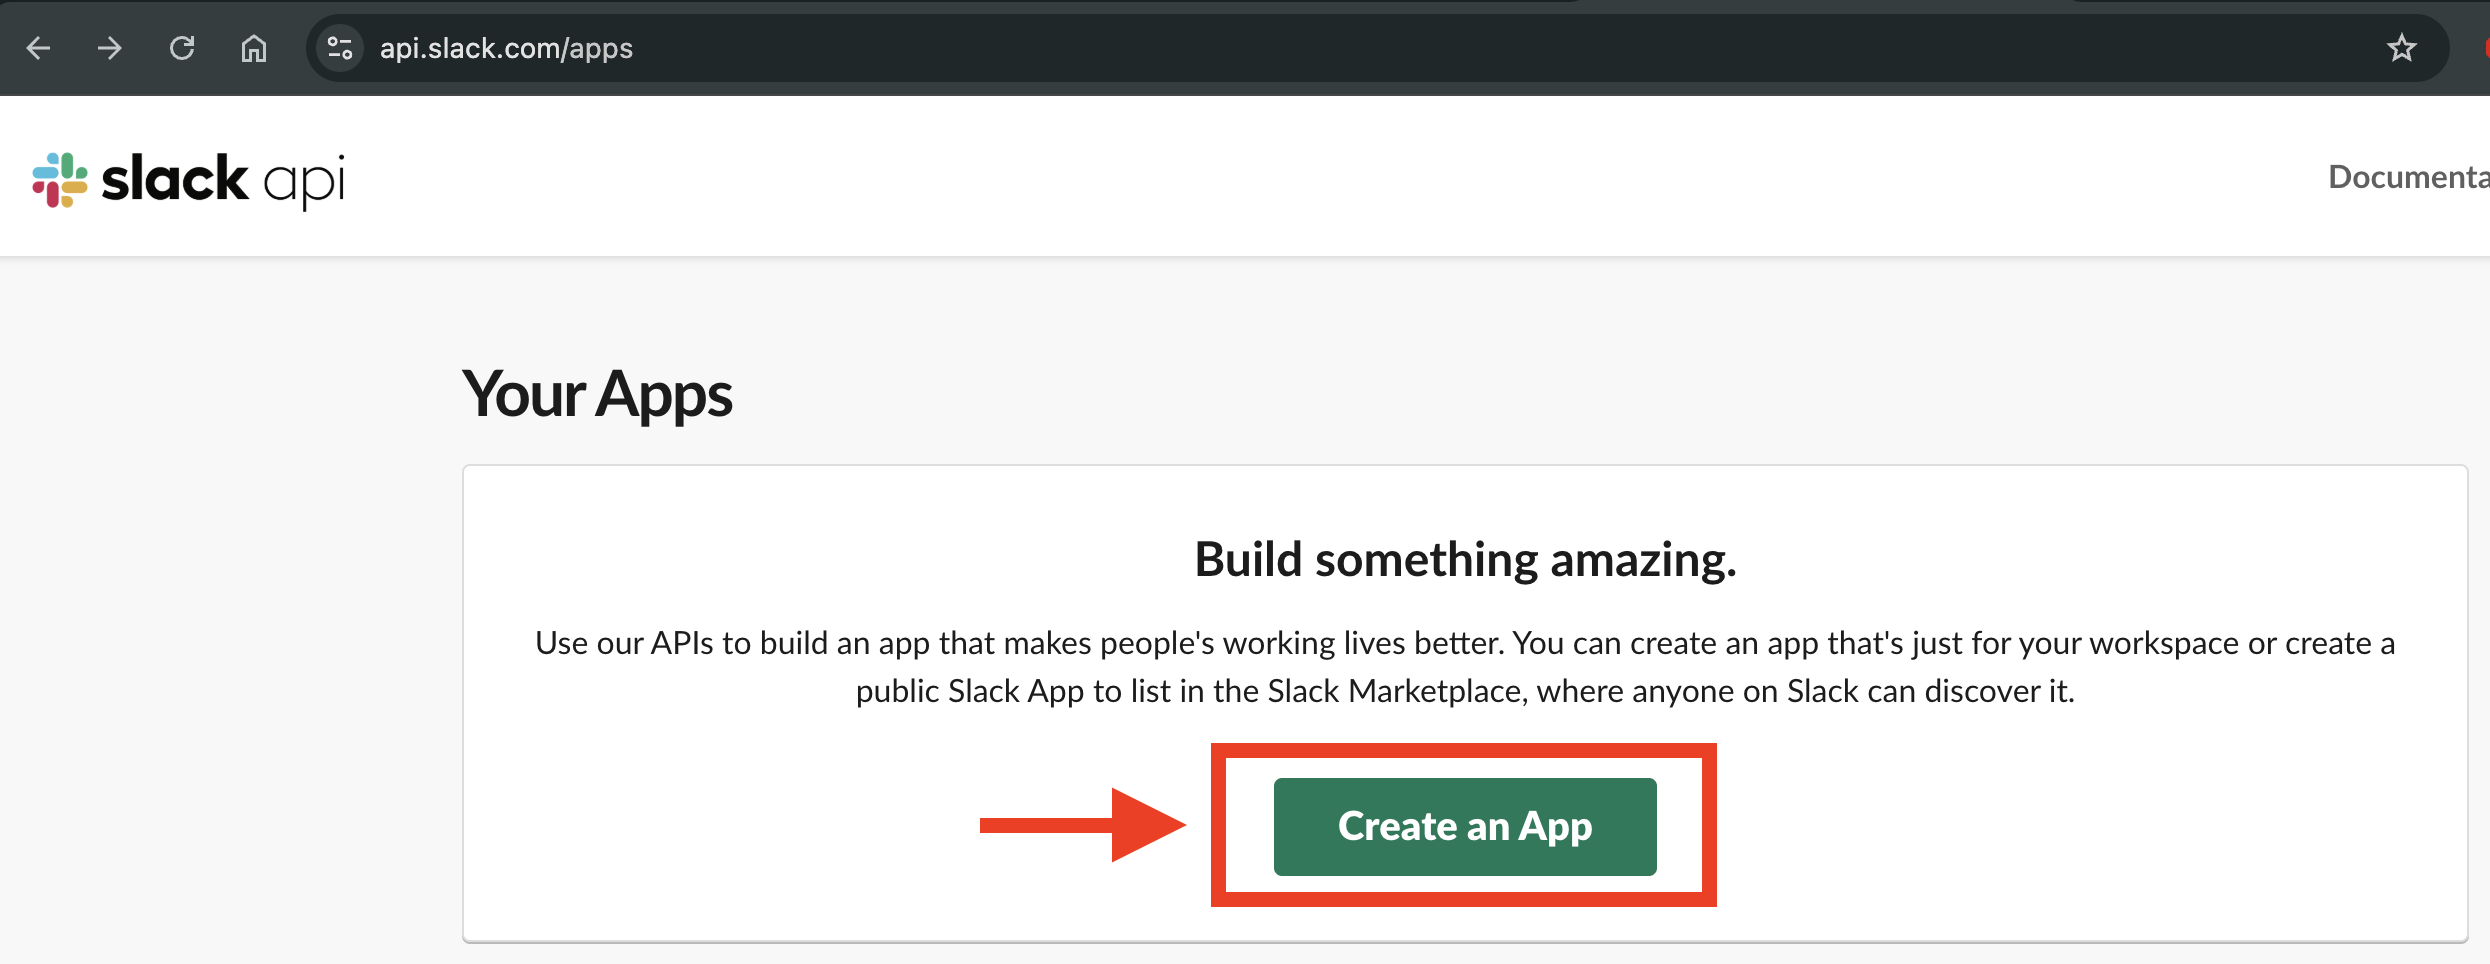
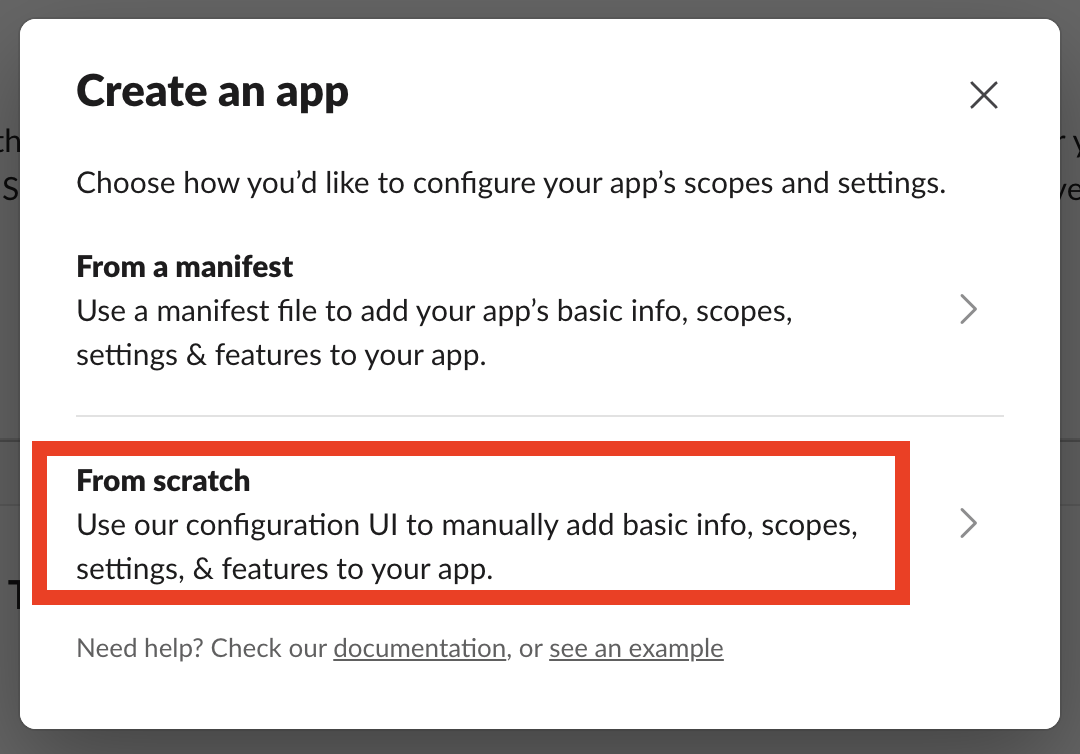
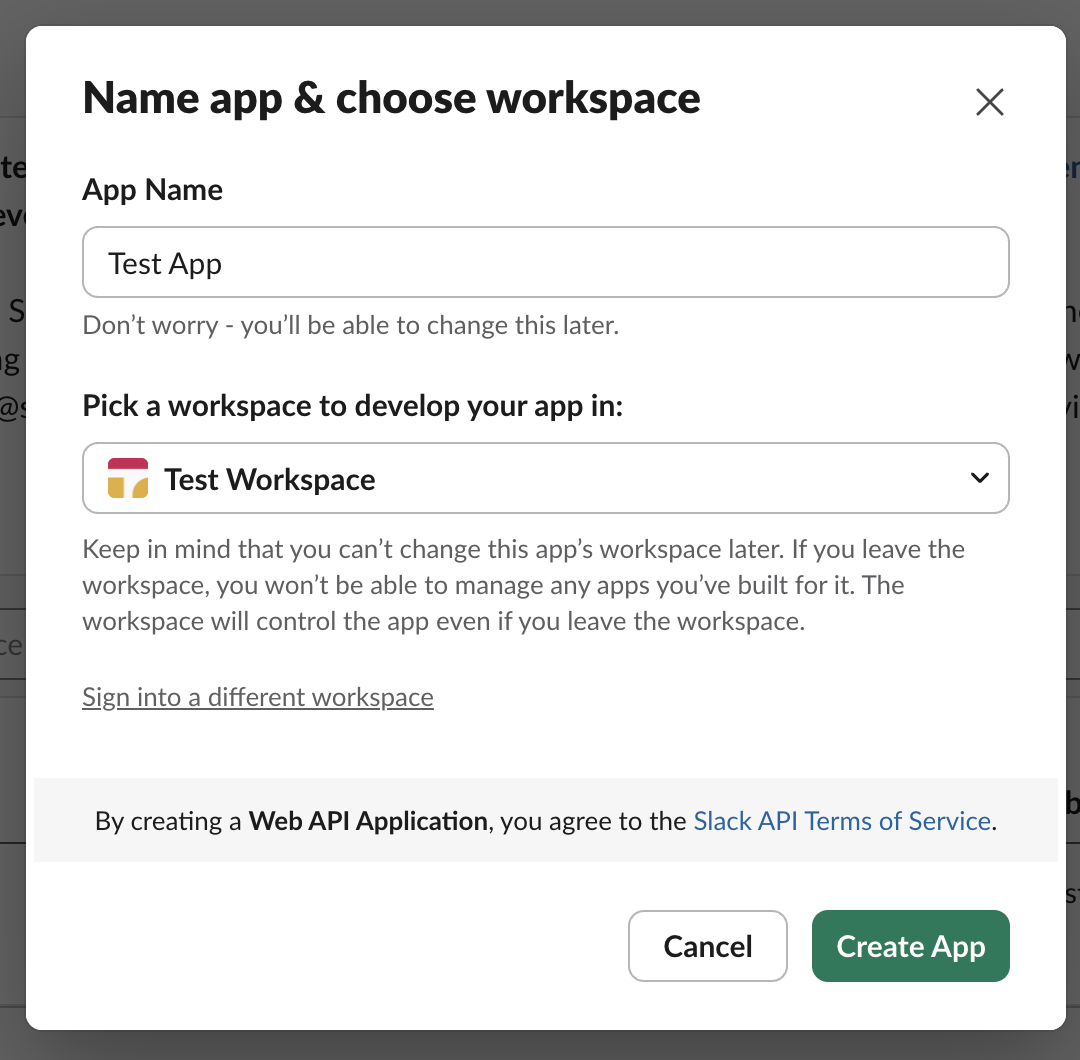
- Search for “Incoming Webhooks” and add it to your workspace

- Choose a channel where alerts should be posted
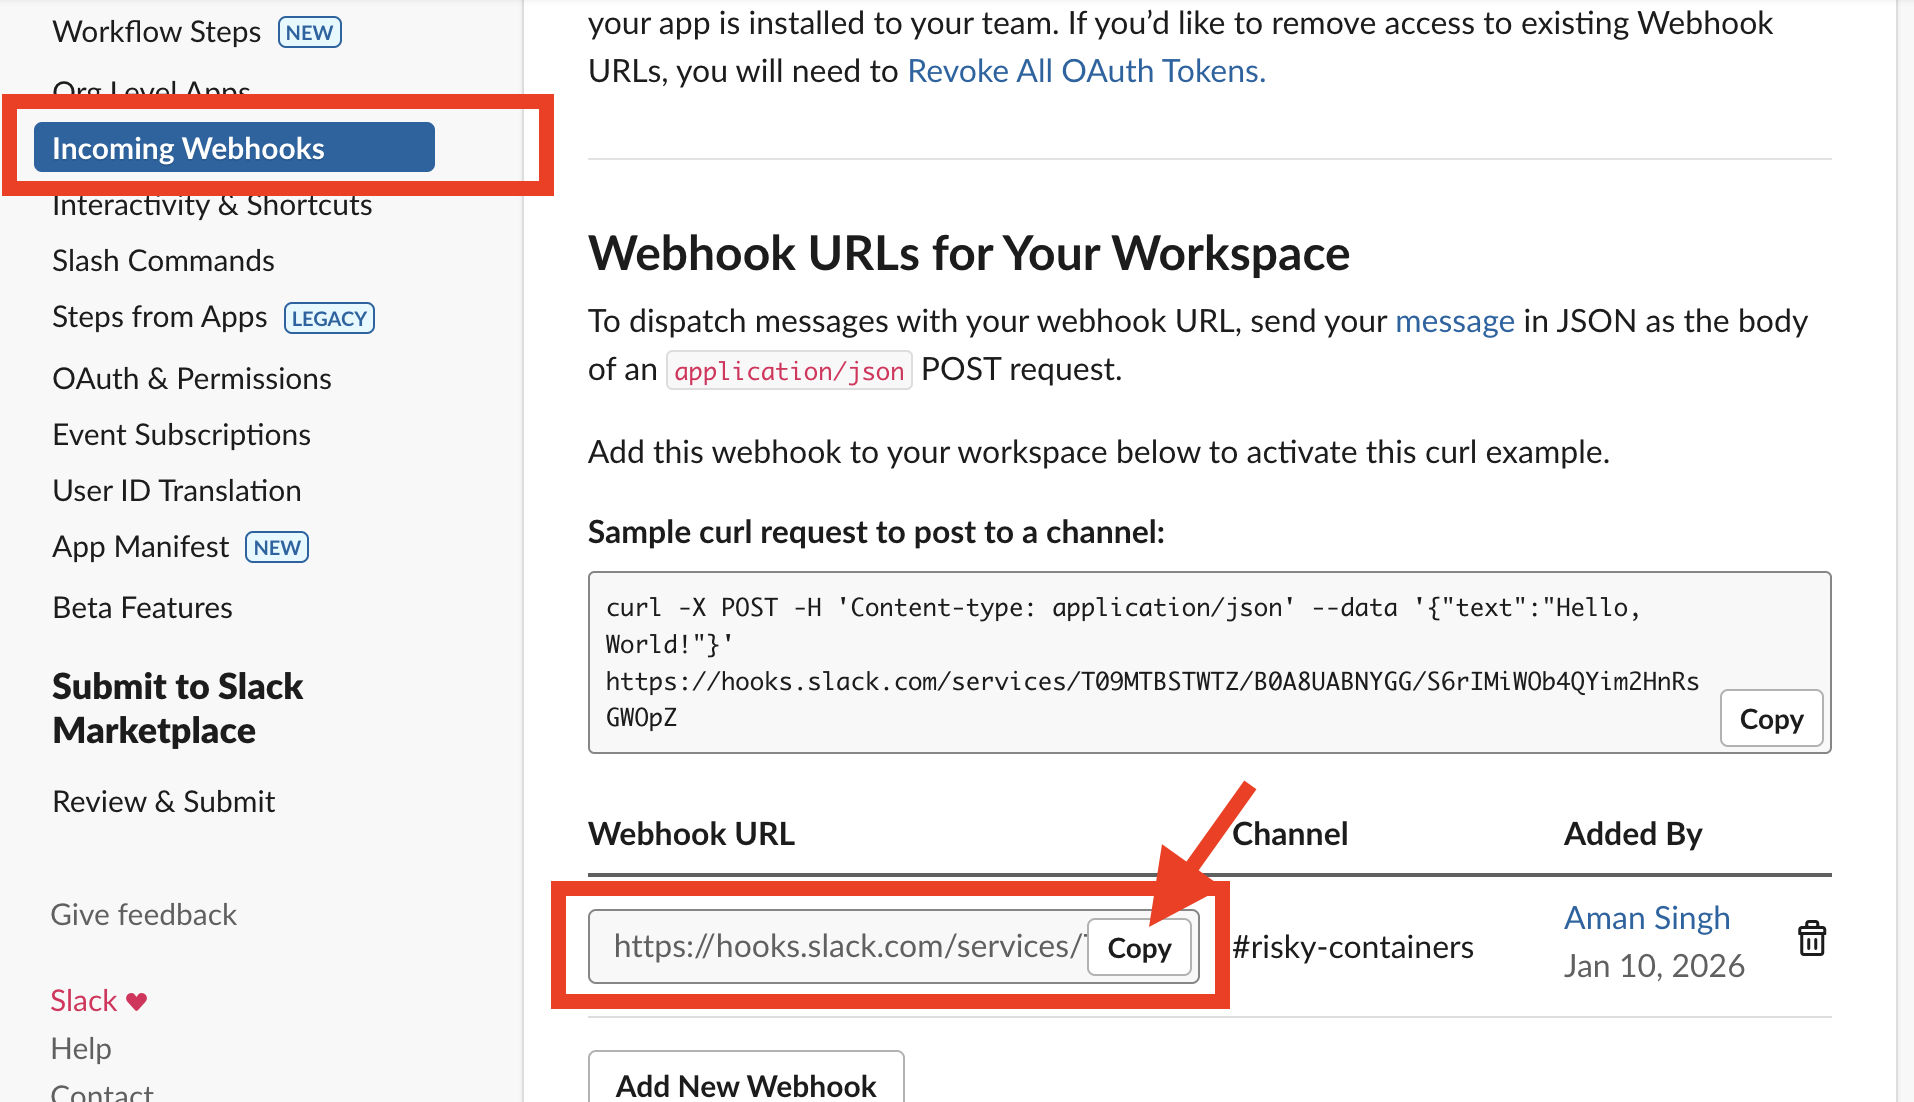
- Copy the Webhook URL (it looks like
https://hooks.slack.com/services/<YOUR_SLACK_WEBHOOK_URL>)
Store the Webhook URL as a Secret
Create a Kubernetes secret with your Slack webhook URL. Edit resources/slack-url.yaml and replace the placeholder with your actual webhook URL:
apiVersion: v1
kind: Secret
metadata:
  name: slack-webhook
  namespace: drasi-system
type: Opaque
stringData:
  slack-webhook-url: "https://hooks.slack.com/services/<YOUR_SLACK_WEBHOOK_URL>"
Apply the secret:
kubectl apply -f ./resources/slack-url.yaml
Deploy the Slack Reaction
The Slack reaction is defined in drasi/reaction.yaml. It uses an HTTP reaction to send formatted messages to Slack:
apiVersion: v1
kind: Reaction
name: alerts-slack
spec:
  kind: Http
  properties:
    baseUrl:
      kind: Secret
      name: slack-webhook
      key: slack-webhook-url
    timeout: 30000

  queries:
    risky-containers: >
      added:
        method: "POST"
        url: ""
        headers:
          "Content-Type": "application/json"
        body: |
          {
            "blocks": [
              {
                "type": "header",
                "text": {
                  "type": "plain_text",
                  "text": "🚨 Risky Container Detected"
                }
              },
              {
                "type": "section",
                "fields": [
                  { "type": "mrkdwn", "text": "*Pod:*\n`{{after.pod}}`" },
                  { "type": "mrkdwn", "text": "*Namespace:*\n`{{after.namespace}}`" },
                  { "type": "mrkdwn", "text": "*Container:*\n`{{after.name}}`" },
                  { "type": "mrkdwn", "text": "*Image:*\n`{{after.image}}`" },
                  { "type": "mrkdwn", "text": "*Reason:*\n{{after.reason}}" },
                  { "type": "mrkdwn", "text": "*Mitigation:*\n{{after.mitigation}}" }
                ]
              }
            ]
          }

      deleted:
        method: "POST"
        url: ""
        headers:
          "Content-Type": "application/json"
        body: |
          {
            "blocks": [
              {
                "type": "header",
                "text": {
                  "type": "plain_text",
                  "text": "✅ Risky Container Resolved"
                }
              },
              {
                "type": "section",
                "fields": [
                  { "type": "mrkdwn", "text": "*Pod:*\n`{{before.pod}}`" },
                  { "type": "mrkdwn", "text": "*Namespace:*\n`{{before.namespace}}`" },
                  { "type": "mrkdwn", "text": "*Container:*\n`{{before.name}}`" },
                  { "type": "mrkdwn", "text": "*Image:*\n`{{before.image}}`" }
                ]
              }
            ]
          }
This reaction:
- Sends a 🚨 alert when a risky container is added to the result set
- Sends a ✅ notification when a risky container is resolved (deleted from the result set)
- Includes pod name, namespace, container name, image, reason, and mitigation in alerts
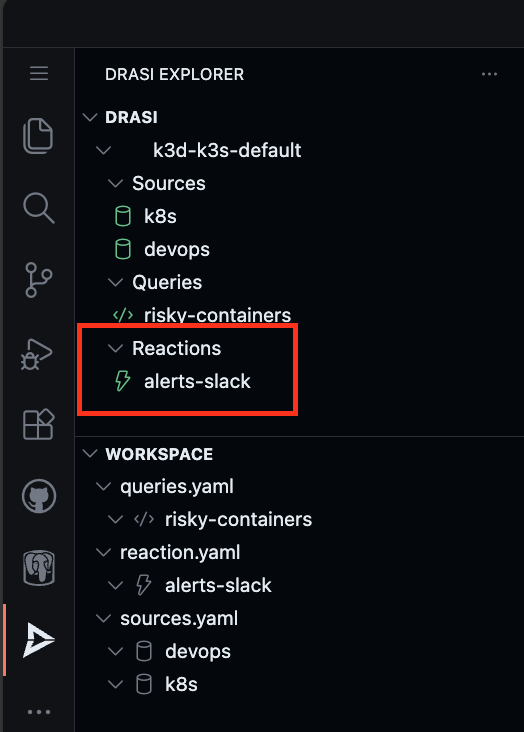
Find the reaction alerts-slack in the Workspace inside Drasi VSCode Extension and click “Apply”.
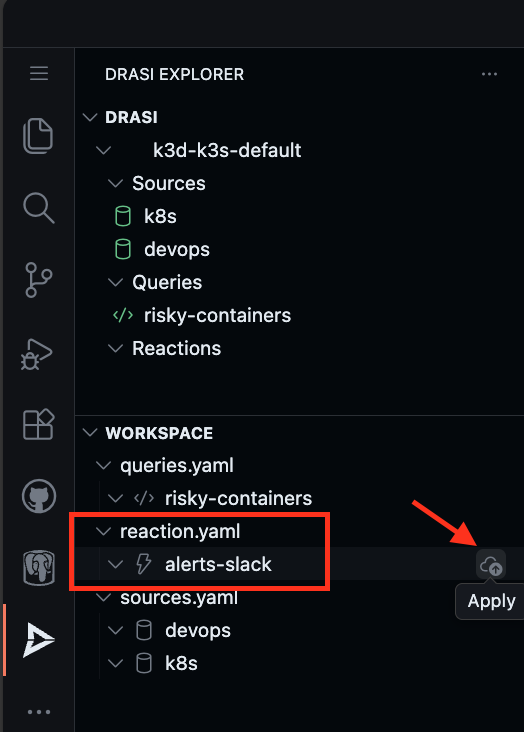
Wait for the reaction to show a Green icon indicating it is ready.
Deploy the reaction:
drasi apply -f ./drasi/reaction.yaml
Wait for the reaction to be ready:
drasi wait -f ./drasi/reaction.yaml -t 180
Check the status:
drasi list reaction
The reaction should show AVAILABLE as true:
      ID      | AVAILABLE | INGRESS URL | MESSAGES
--------------+-----------+-------------+-----------
  alerts-slack | true      |             |
Test the Slack Alerts
Now once the reaction is deployed, you should have received a Slack notification in your configured channel:
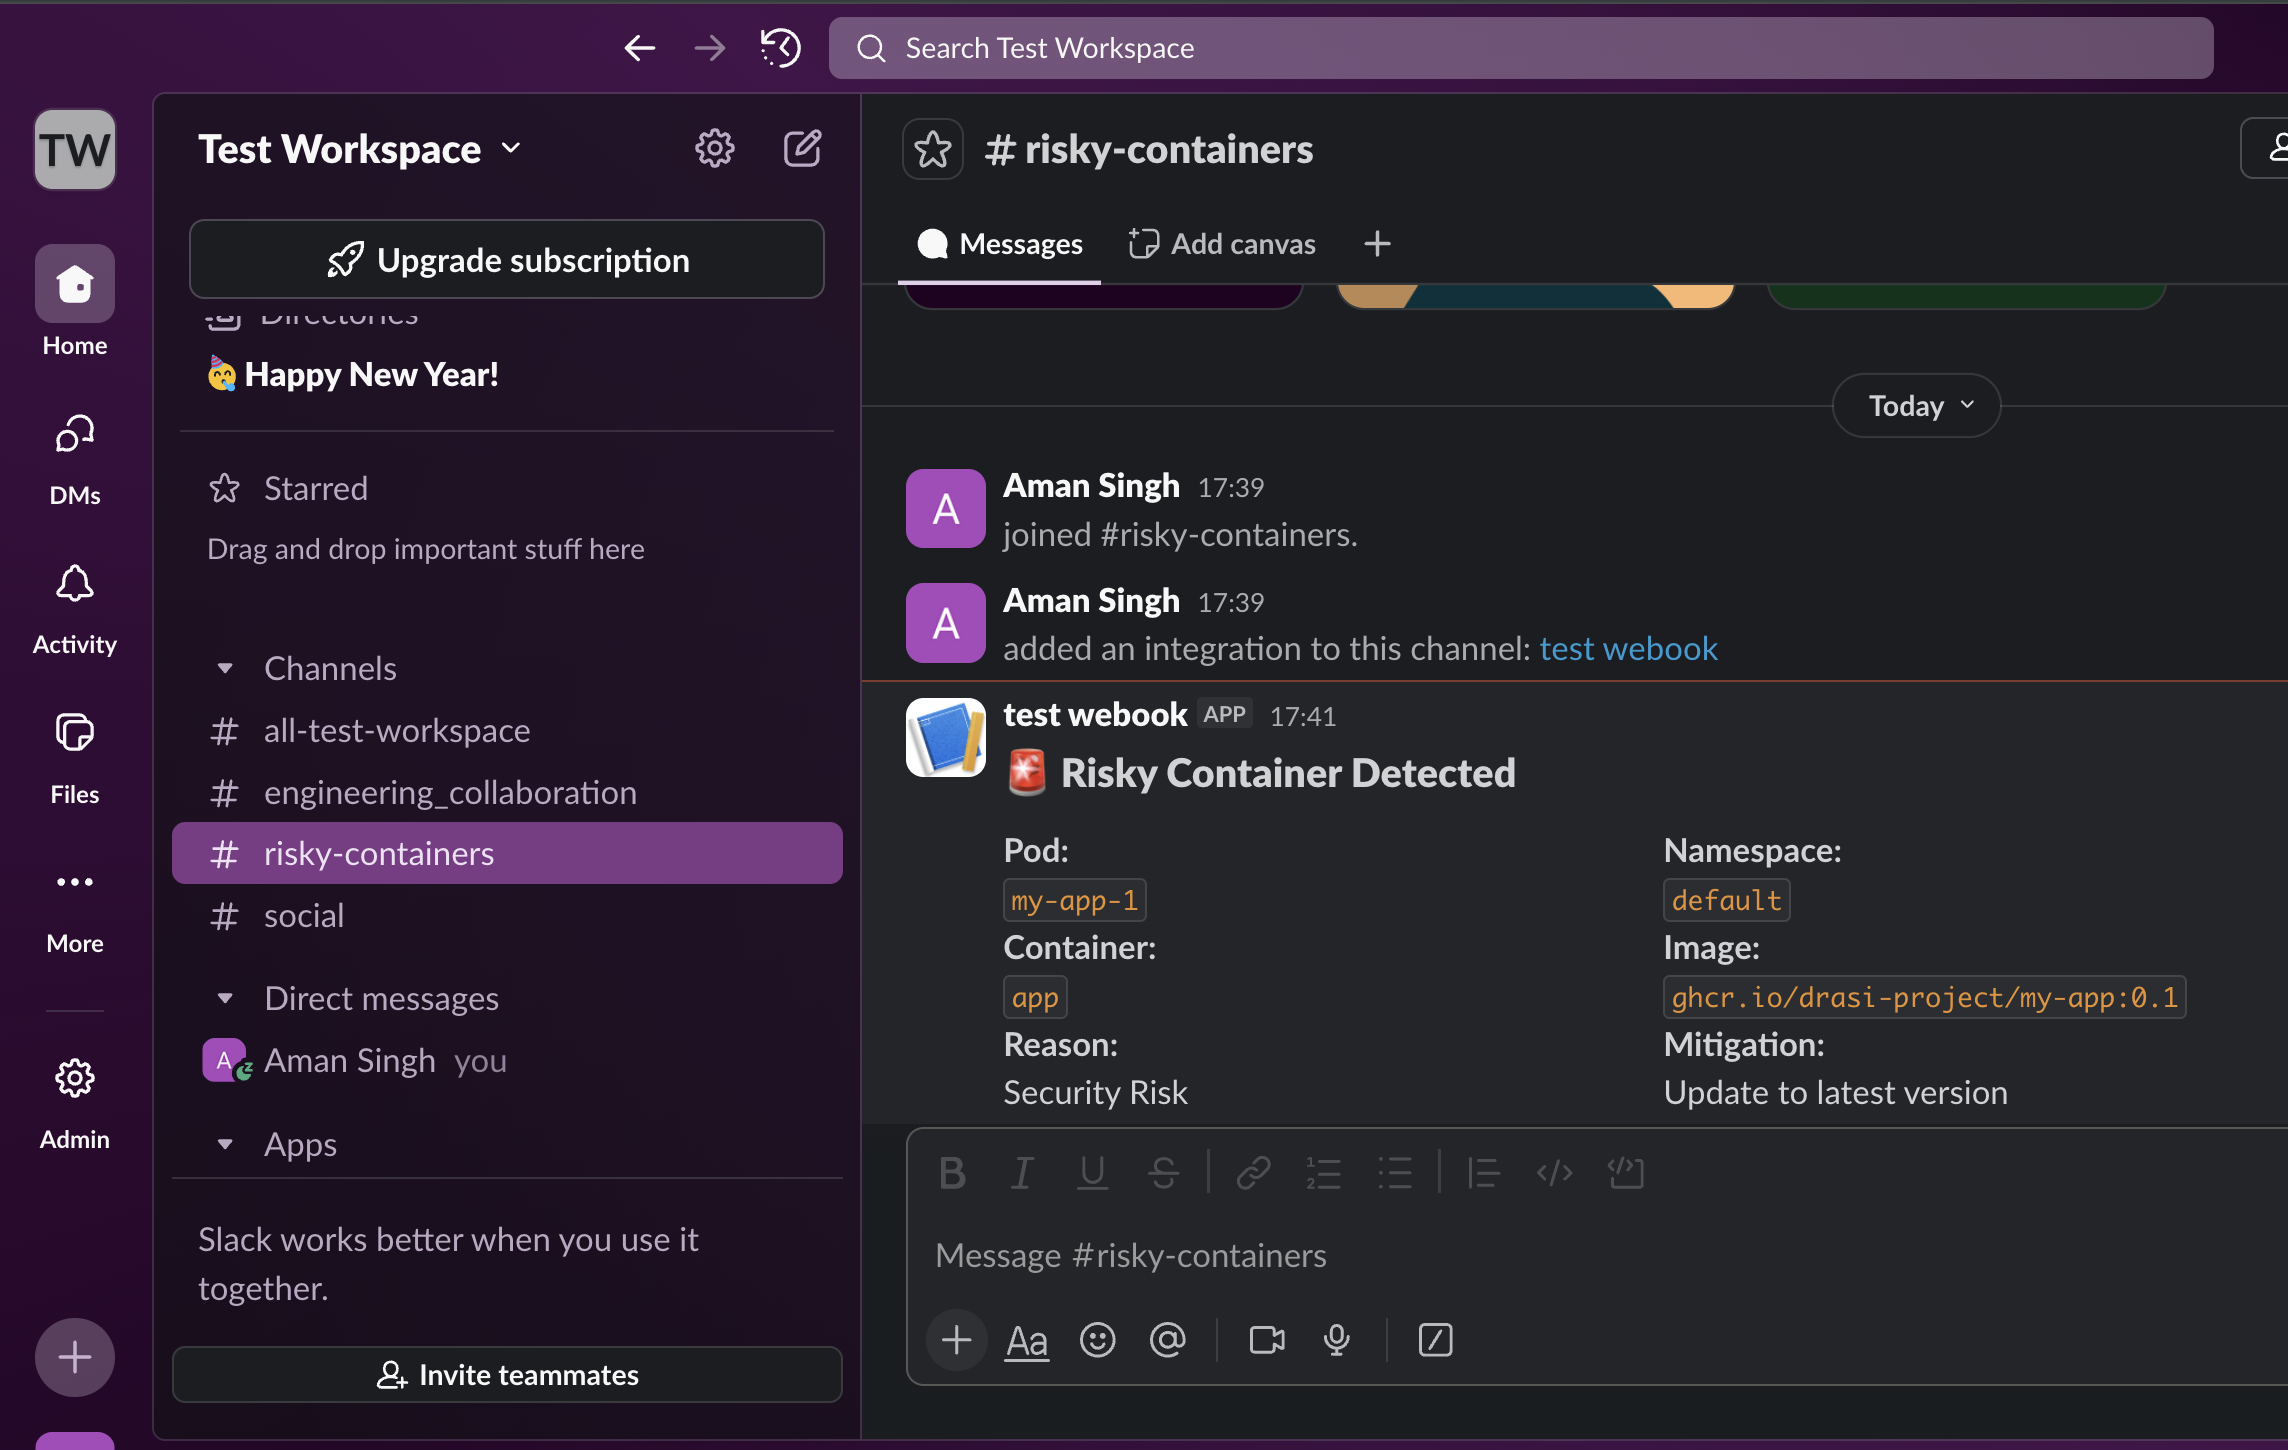
This alert is for the my-app-1 pod that is still running with a vulnerable image on the cluster.
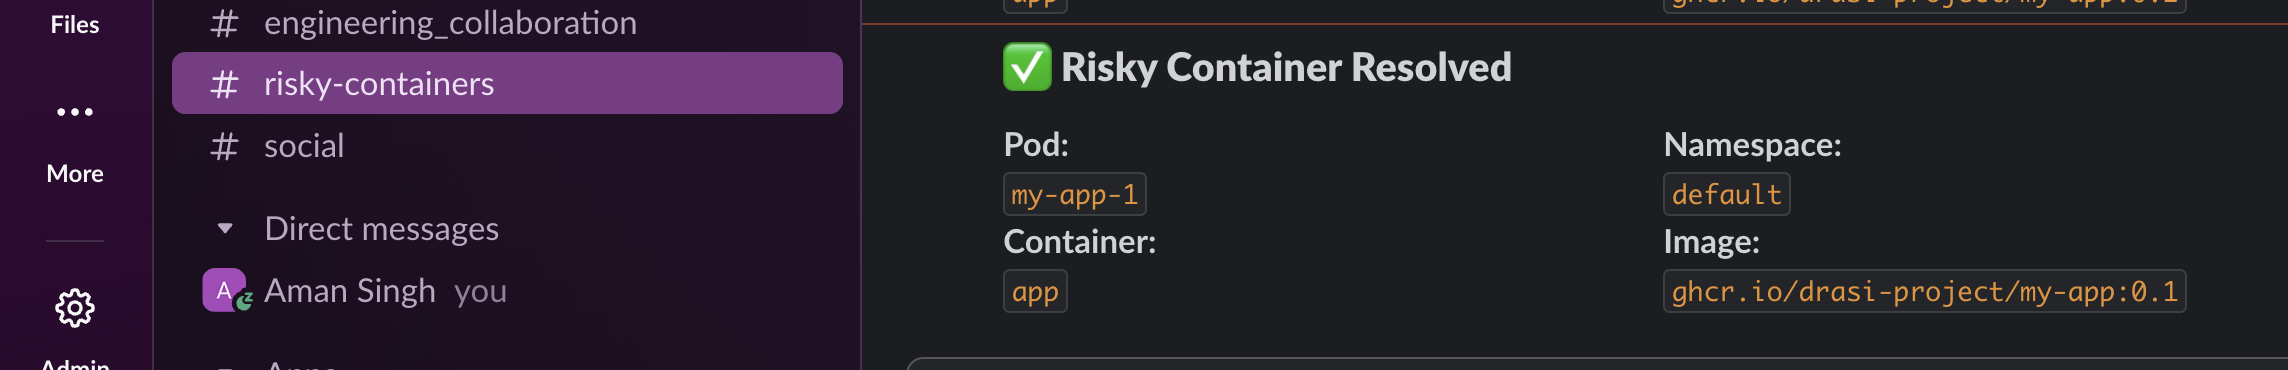
If we use kubectl to upgrade the Pod from version 0.1 to 0.3, which will make it disappear from the result set.
kubectl set image pod/my-app-1 app=ghcr.io/drasi-project/my-app:0.3
kubectl wait --for=condition=Ready pod/my-app-1 --timeout=60s
Once the pod is ready with the new image, we see a “Risky Container Resolved” notification in Slack.
Reflection
Congratulations! You have successfully used Drasi to create a real-time system that detects risky container images running in your Kubernetes cluster.
Key Takeaways
Multi-Source Queries
This tutorial demonstrated how Drasi can join data from multiple sources:
- PostgreSQL: Stores the list of risky images with reasons and mitigations
- Kubernetes: Provides real-time pod and container information
Unwind Middleware
The unwind middleware is powerful for extracting nested arrays (like containerStatuses) and promoting them to first-class graph nodes that can be queried and joined.
Real-time Reactiveness
As you observed:
- Adding a risky image to the database immediately flags running containers
- Upgrading a pod to a safe image version immediately removes it from alerts
- No polling or scheduled jobs required - changes are detected instantly
Cleanup
Simply close the codespace window - No cleanup required. You may choose to delete your codespace to avoid additional billed usage.
Simply close your devcontainer and clean it up using the VS Code extension. Or, you can delete the docker container from Docker Desktop.
To clean up the tutorial resources, run the following commands:
drasi delete -f ./drasi/queries.yaml
drasi delete -f ./drasi/sources.yaml
kubectl delete -f ./resources/my-app.yaml
kubectl delete -f ./resources/postgres.yaml
kubectl delete secret k8s-context -n drasi-system
If you set up Slack alerts, also run:
drasi delete -f ./drasi/reaction.yaml
kubectl delete -f ./resources/slack-url.yaml
Further reading
- Learn more about Drasi sources here.
- Learn more about Continuous queries here.
- Learn more about Drasi Reactions here.
- Explore the Kubernetes Source documentation.
- Learn about query middleware for advanced data transformations.
Feedback
Was this page helpful?
Glad to hear it! Please tell us what you found helpful.
Sorry to hear that. Please tell us how we can improve.